
Visio process lenses: RACI, value stream, risk & automation (no redraw)
A single process map can support many different conversations — but only if it stays consistent. When teams maintain separate Visio files (RACI version, value stream version, risk version), they drift.
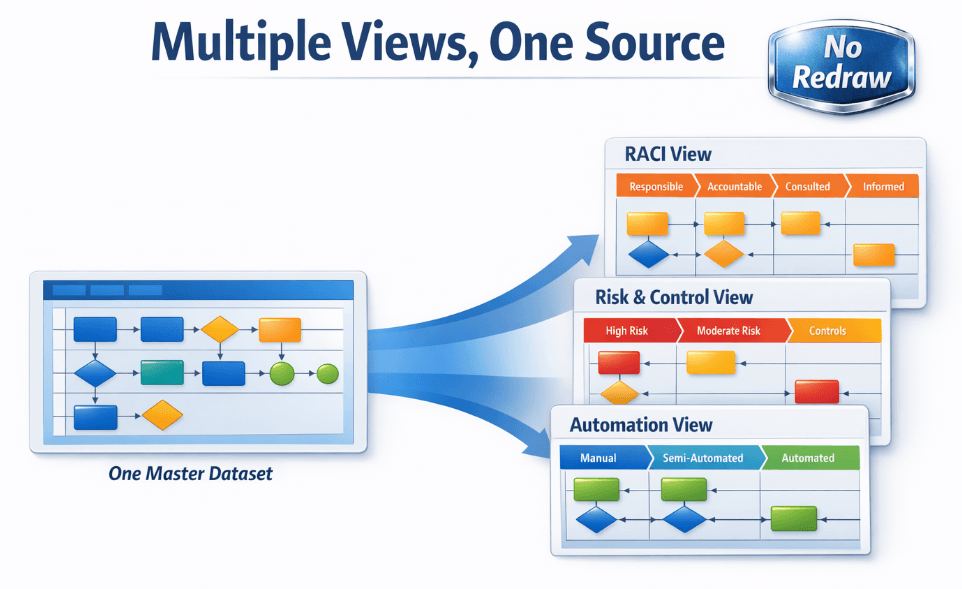
The dataset-driven approach is simpler: convert the diagram into a Data Visualizer dataset, keep that dataset as the source of truth, and generate multiple “lenses” as views — without redrawing.
What is a “lens”?
A lens is an alternate view of the same underlying process. You keep the flow (IDs + connections) constant, then add extra columns for analysis, ownership, and prioritization.
Key idea: keep one dataset as the truth. Build views from it. Don’t maintain multiple drifting Visio files.
Example lenses teams use
| Lens | What you add to the dataset | What you can do with it |
|---|---|---|
| RACI | Responsible, Accountable, Consulted, Informed | Clarify ownership; reduce “everyone owns it” ambiguity; speed approvals. |
| Value stream | Value-added vs non-value-added, wait time, cycle time | Identify bottlenecks and delays; target high-impact improvements. |
| Risk & controls | Risk level, control type, evidence required | Support compliance audits; reduce control gaps; standardize documentation. |
| Automation | System/tool, automation candidate, manual effort estimate | Find quick wins; prioritize automation; reduce rework. |
How to build lenses without redrawing
- Convert the diagram into a dataset (diagram → dataset) and clean up IDs + connections.
- Add lens columns in Excel (RACI, cycle time, risk, automation tags, etc.).
- Generate a “lens” view by filtering/highlighting in Excel and regenerating a diagram from the dataset.
- Repeat for other lenses — without copying the entire Visio file.
If you want to audit the process first, start here: Audit in Excel.
FAQ
Do lenses require different diagrams?
You can generate different diagrams if you want, but the main win is maintaining one dataset and producing different views from it — even if those views live as Excel filters or multiple exported diagrams.
Will this change the meaning of my original diagram?
No. The flow stays the same. Lenses add columns that make analysis and ownership explicit.
How does AI fit in?
AI works better on datasets than drawings. Once you have lens columns, AI can highlight inconsistencies, missing owners, and improvement opportunities. See: AI analysis.
Microsoft, Visio, and Excel are trademarks of Microsoft. This product is an independent tool and is not affiliated with Microsoft.