
Most process maps don’t fail because the team can’t draw. They fail because the drawing can’t keep up with reality. This series shows a practical fix: treat the process as data, and let Visio render the diagram as a view.
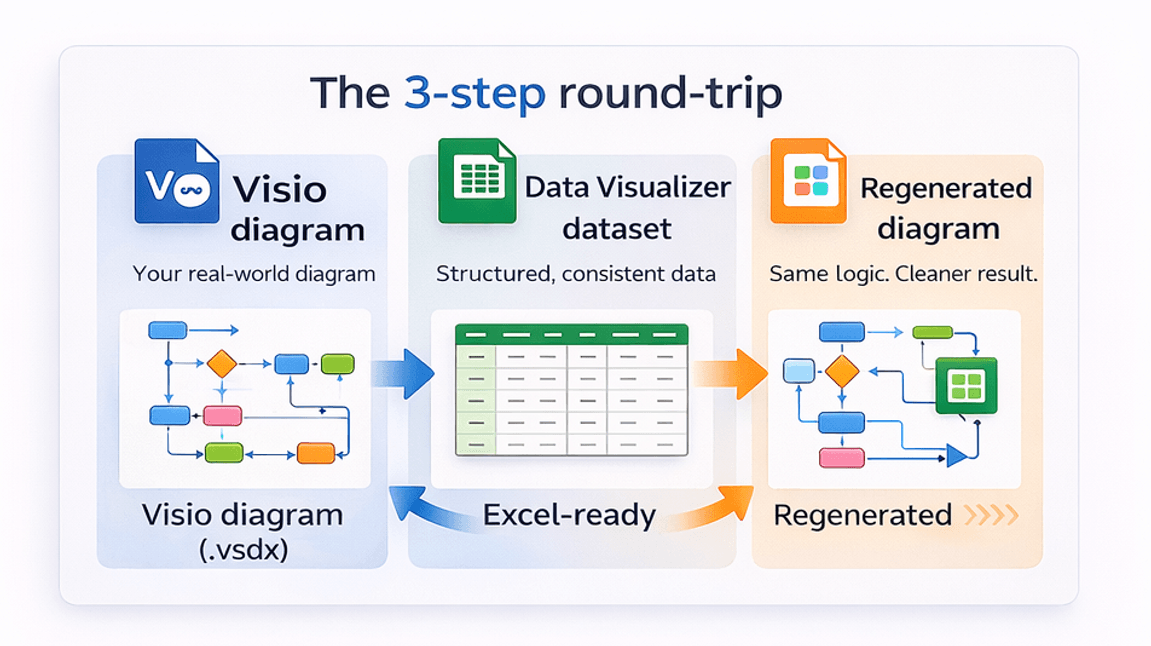
One-line idea: Convert an existing Visio diagram into the Data Visualizer dataset so you can audit and update the process in Excel, then regenerate clean diagrams on demand.
Important distinction: The Excel/Visio “Data Visualizer” flow is typically dataset → diagram. This workflow is the opposite: diagram → dataset.
Microsoft, Visio, and Excel are trademarks of Microsoft. This is an independent tool and is not affiliated with Microsoft.
Why “dead diagrams” happen
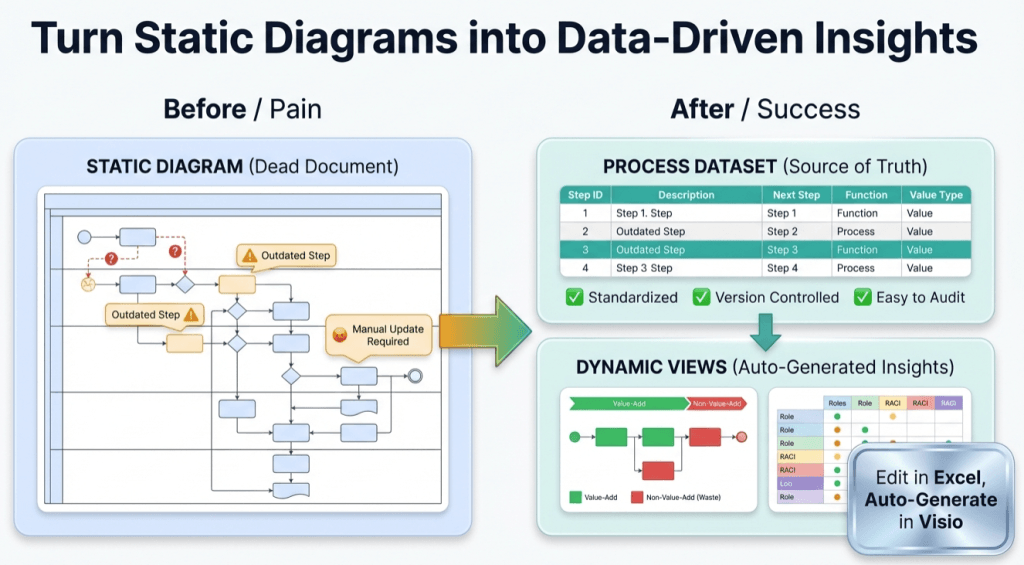
A Visio diagram is great for communicating a process. It’s a rough fit for maintaining a process. The moment a real-world change happens—handoff shifts, a step gets added, the approval path changes—you have to do a layout project just to keep the diagram readable.
That’s why the diagram starts drifting: it’s painful to update, so updates stop happening, so the diagram becomes “documentation” instead of a living model.
The fix: flip the source of truth
When the dataset is the source of truth, updates become edits to a table (fast, auditable, versionable), and the diagram becomes a generated view (clean layout without manual rework).
If your immediate goal is exporting a diagram into a spreadsheet, use this dedicated entry point: Convert a Visio diagram to Excel (diagram → dataset).
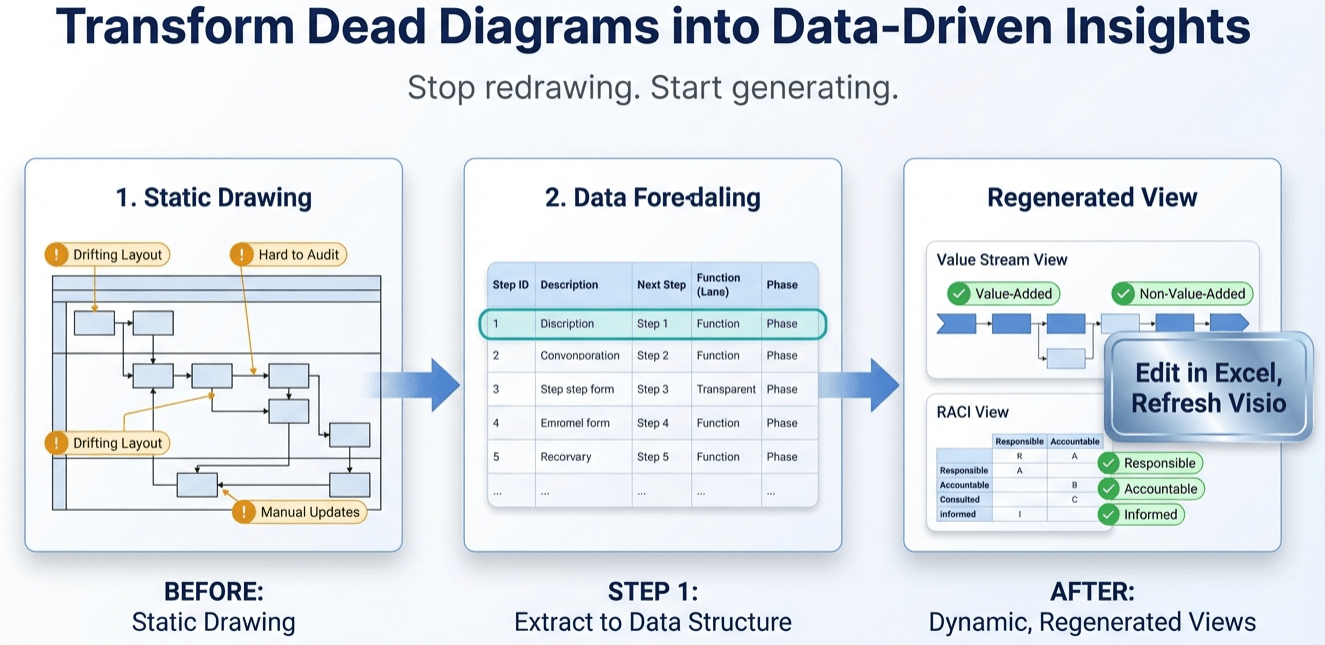
The 3-step loop (diagram → data → diagram)
1) Convert the diagram into a Data Visualizer dataset
Extract each step and connector into rows and columns (Step ID, Description, Next Step IDs, lane/phase, etc.). Once it’s a dataset, you can scan it, filter it, and run consistency checks.
2) Generate a linked Data Visualizer diagram
Import the dataset into Visio’s Cross-Functional Flowchart (Data Visualizer). Now the diagram is connected to the data, and refresh becomes a normal part of maintenance.
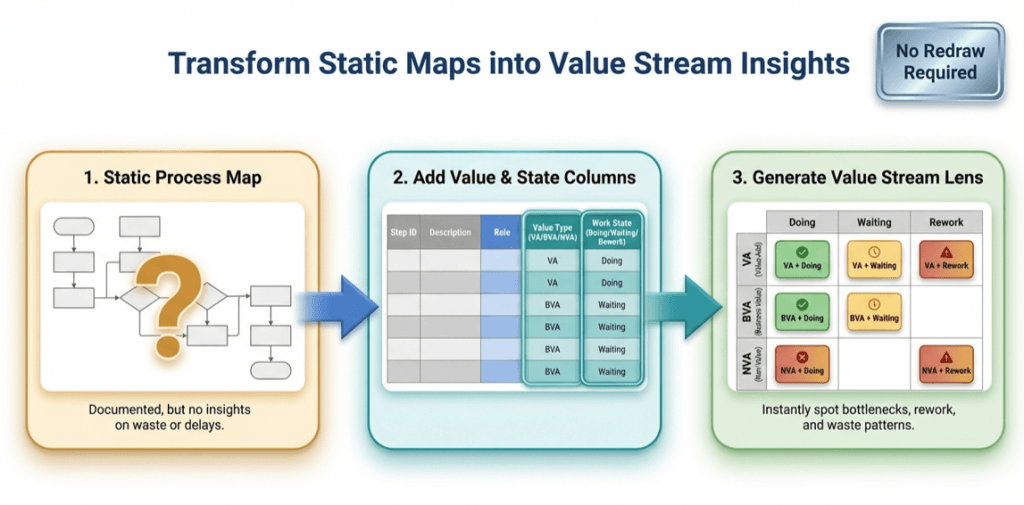
3) Add “lenses” to answer different questions
The same underlying process can be re-laned or re-phased to create multiple decision-ready views: value stream, RACI, risk & control, automation candidates, systems touchpoints, customer experience, and more.
Who this is for (best-fit use case)
This is most valuable if you maintain cross-functional flowcharts / swimlane diagrams in Visio and you need:
- Fast audits for consistency and gaps (without clicking shape-by-shape)
- Frequent updates (reorgs, standardization, continuous improvement)
- Multiple stakeholder views without maintaining multiple conflicting diagrams
- Dataset-first AI analysis (models reason better over structured data than over pixels)
If you want the full “how,” start with the series:
- Pt. 1: Turn a process diagram into process data
- Pt. 2: Add the value stream lens (VA/BVA/NVA × Doing/Waiting/Rework)
- Pt. 3: One process model, many views (RACI, risk, automation, systems)
Start here if you want results fast
- Pick one real diagram that causes pain (handoffs, rework, waiting).
- Run Lite to export the first 20 steps and prove the workflow end-to-end.
- Import into Data Visualizer and verify it regenerates cleanly.
- Upgrade to Standard when you’re ready to convert the full diagram (unlimited steps).
Download Lite (Free) Buy Standard
FAQ
Is this a “replacement” for the Excel Visio Data Visualizer add-in?
No. It solves the reverse problem. The add-in is for dataset → diagram. This tool helps when you already have a diagram and you need diagram → dataset.
What’s the practical benefit of having the process in a dataset?
Speed and control. Updates become table edits, audits become checks, and you can generate multiple views without maintaining multiple diagrams.
What kind of Visio diagrams work best?
Cross-functional flowcharts (swimlanes + phases) are the best fit because they map cleanly to Data Visualizer’s lane and phase fields.
Do I have to upload my diagram anywhere?
No. The generator runs locally on Windows. You choose where files live and what you share.
Where should I go next?
If you want the “how,” read Pt. 1. If you want the tool, start with Lite. If you want the full feature set, see the Standard generator page.
More to come…