
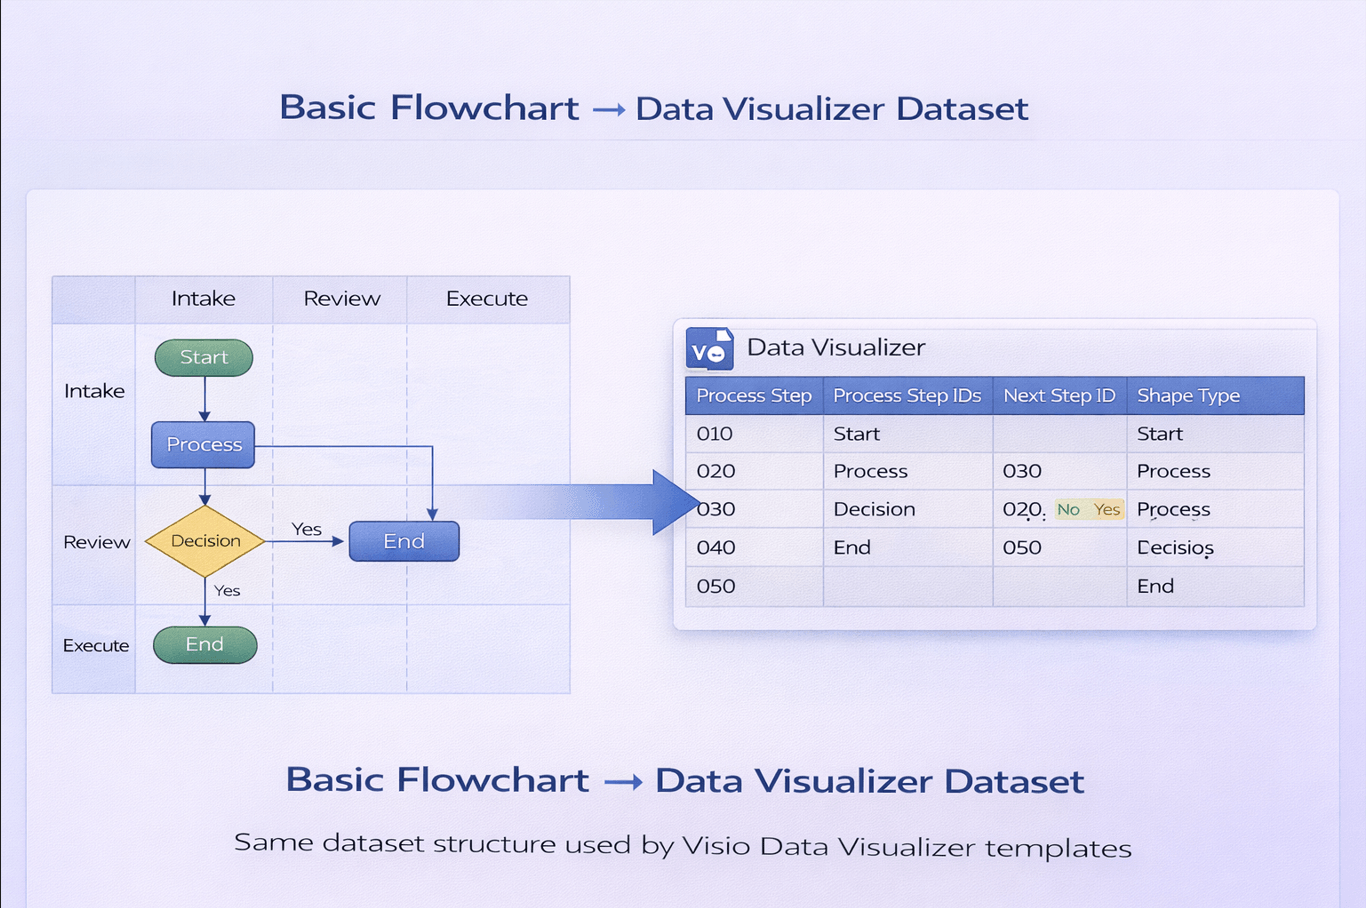
Basic flowchart dataset example (simple, copy/paste)
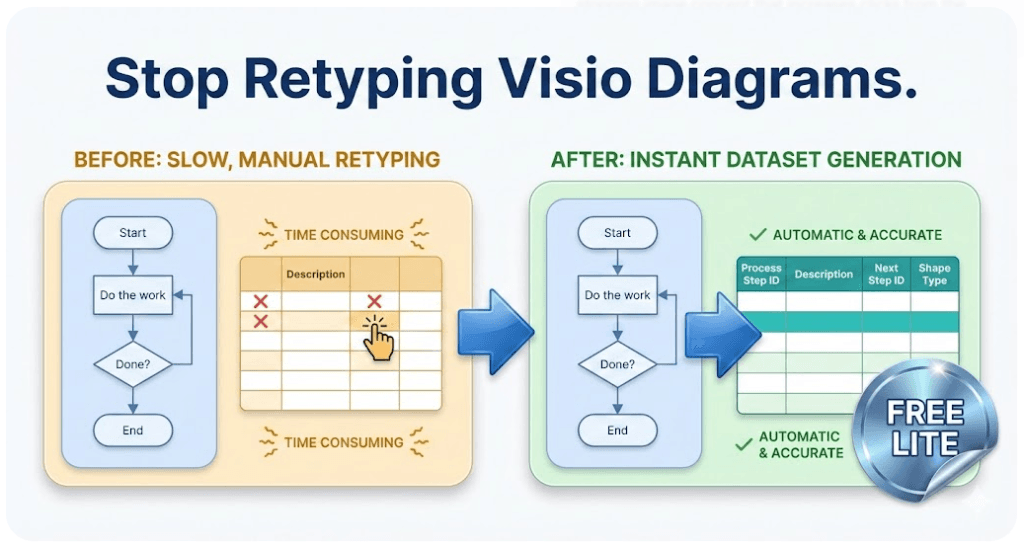
This example is a minimal Data Visualizer dataset you can use to sanity-check your IDs, connectors, and shape types. It’s useful when you want to prove the import pipeline without swimlanes/phases.
If your starting point is an existing Visio diagram and you want the dataset in Excel, use: Convert a Visio diagram to Excel (diagram → dataset).
Try Lite (Free) Dataset format rules
Example dataset table
Notice the same fundamentals: unique IDs, valid Next Step IDs, and correct Shape Type values.
| Process Step ID | Process Step Description | Next Step ID | Shape Type |
|---|---|---|---|
| 1 | Start | 2 | Start/End |
| 2 | Collect inputs | 3 | Process |
| 3 | Decision point | 4,5 | Decision |
| 4 | Path A | 6 | Process |
| 5 | Path B | 6 | Process |
| 6 | End | Start/End |
How to use this example
- Create an Excel sheet with the columns above.
- Paste the rows.
- Import into the appropriate Data Visualizer template in Visio and regenerate.
If you’re working with swimlanes/phases, use: Cross-functional example.
Common patterns you can model
- Start/End: make sure you have one clear start and one clear end.
- Decisions: branch to multiple next steps and converge to a single later step.
- Loops: point a Next Step ID back to an earlier step (then validate the loop makes sense).
If your import fails, go to: Import troubleshooting.
If your goal is exporting a real diagram into Excel, start here: Convert a Visio diagram to Excel (diagram → dataset).
Back to hub · Convert a Visio diagram to Excel
Microsoft, Visio, and Excel are trademarks of Microsoft. This product is an independent tool and is not affiliated with Microsoft.