Visio diagram to Excel: what people mean (and the 3 outputs they expect)
If you searched “Visio to Excel” and landed here, you’re not alone. The phrase is vague, but the intent is usually very specific.
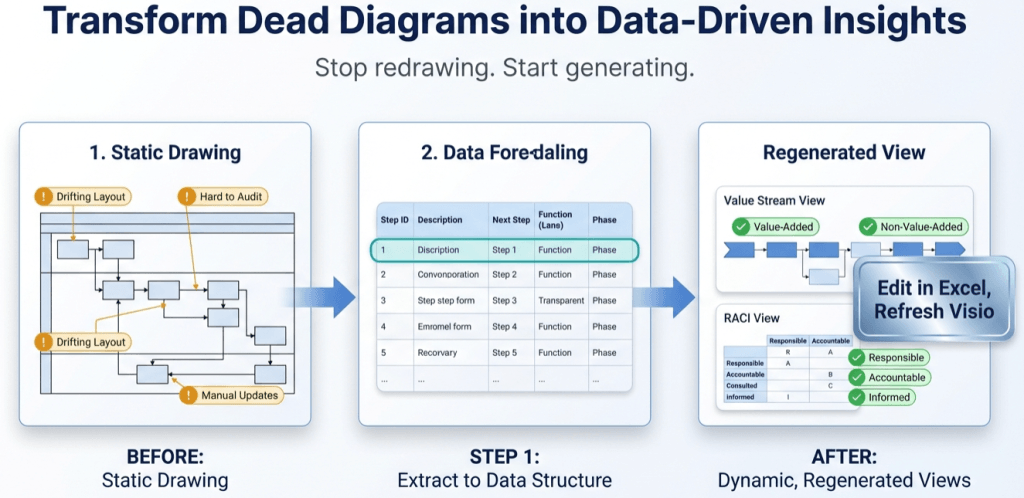
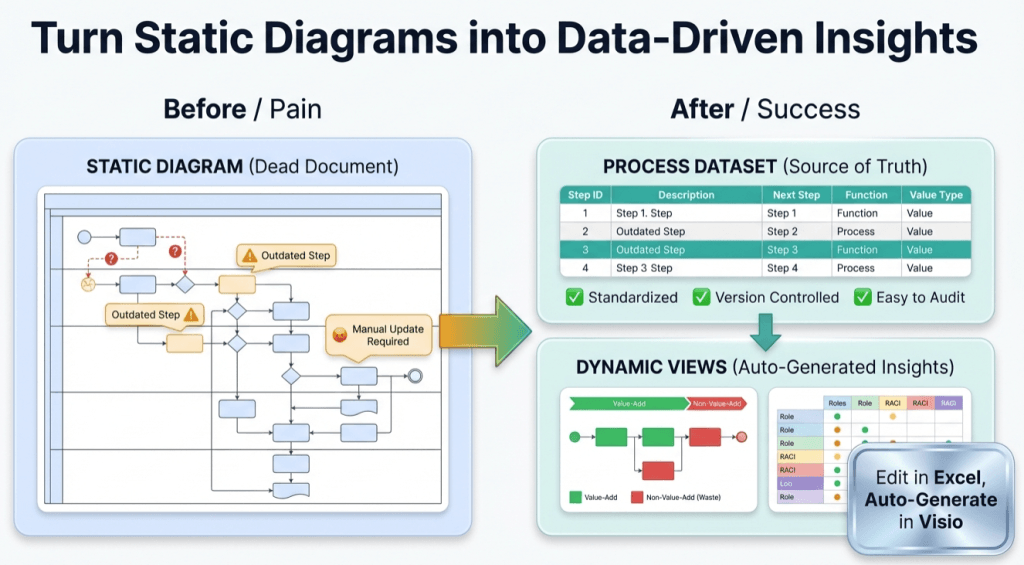
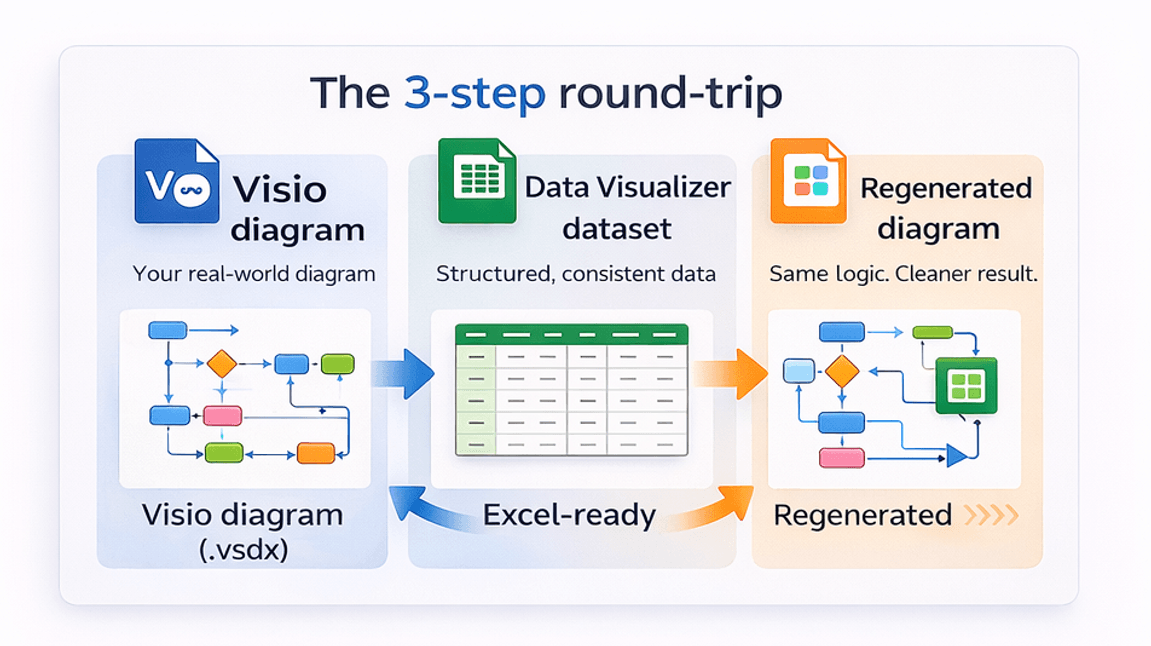
Fast answer: Most people do not want “a picture of a diagram in Excel.” They want structured process data in a table. And the highest-value output is a Data Visualizer-ready dataset – because once your process is data, you can audit, update, version, and regenerate clean diagrams on demand.
Start here: Convert a Visio diagram to Excel (diagram → dataset).
Important distinction: The Excel/Visio “Data Visualizer” direction is typically dataset → diagram. This workflow is the reverse: diagram → dataset.
Microsoft, Visio, and Excel are trademarks of Microsoft. This is an independent tool and is not affiliated with Microsoft.
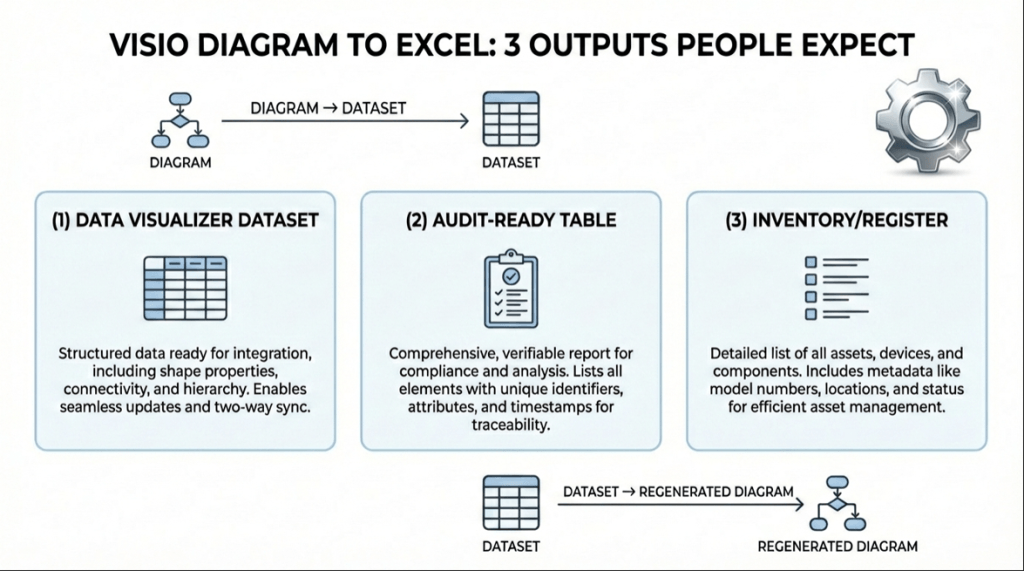
The 3 “Visio to Excel” outputs (pick the one you actually mean)
When someone says “convert a Visio diagram to Excel,” they usually mean 1 of these 3 outputs. If you pick the wrong one, you waste hours – and you still won’t get what you need.
| What you want | What it looks like in Excel | Best fit when… | Start here |
|---|---|---|---|
| 1) Data Visualizer dataset | Step IDs + descriptions + Next Step IDs + lane/phase (cross-functional) | You want to regenerate a clean Data Visualizer diagram from the table | Convert a Visio diagram to Excel (diagram → dataset) |
| 2) Audit-ready process table | Dataset + extra columns (Owner, System, Risk, RACI, time, notes) | You need governance, standardization, CI, or process mining prep | Audit in Excel |
| 3) Inventory / register | A clean list of steps, lanes, phases, and connectors for review | You need review, cleanup, deduping, or AI-ready structure | AI + dataset analysis |
If you are building anything that needs to stay correct over time, output #1 usually wins because it becomes the “source of truth.” Output #2 is what you do after #1 once you can trust the structure.
Output #1: a Data Visualizer dataset (the “regenerate the diagram” table)
This is the output that turns your diagram into something you can manage like a system. You get a dataset with stable IDs and explicit connections between steps.
If your diagram is cross-functional (swimlanes + phases), this dataset typically includes: Process Step ID, Process Step Description, Next Step ID, Shape Type, plus lane/phase fields.
Want the rules and examples so your import does not blow up? Use: Data Visualizer dataset format, plus the: cross-functional dataset example.
Shortcut: If the point is “get the table out of the .vsdx so I can maintain it in Excel,” then this is your move: Convert a Visio diagram to Excel (diagram → dataset).
Output #2: an audit-ready process table (the “make it governable” table)
Once your process is a dataset, you can turn it into a management tool. This is where you stop arguing about the picture and start controlling the system.
Here are high-value columns teams add after conversion:
- Owner / Responsible (who is accountable for correctness)
- System (what application/tool is touched)
- Cycle time and wait time (bottlenecks, queues, rework)
- RACI lens fields (who does, approves, consults, informs)
- Risk / Control fields (SOX, compliance, approvals)
- Notes (why this step exists, gotchas, exceptions)
This is the exact outcome page that lays out the audit method: Audit a Visio process map in Excel.
If you have ever said “we need to standardize the process,” this is the structure that makes it possible.
Output #3: an inventory/register (the “quick cleanup” table)
Sometimes you do not need to regenerate the diagram immediately. You need a clean list so you can review:
- Duplicate steps (“Approve” appears 6 times in 3 different lanes)
- Broken logic (a decision that never reconverges)
- Missing ownership (no lane makes sense for a step)
- Overcomplication (rework loops, ping-pong handoffs)
This is also where AI becomes useful, because LLMs reason better over structure than over pixels. See: AI + Visio dataset analysis.
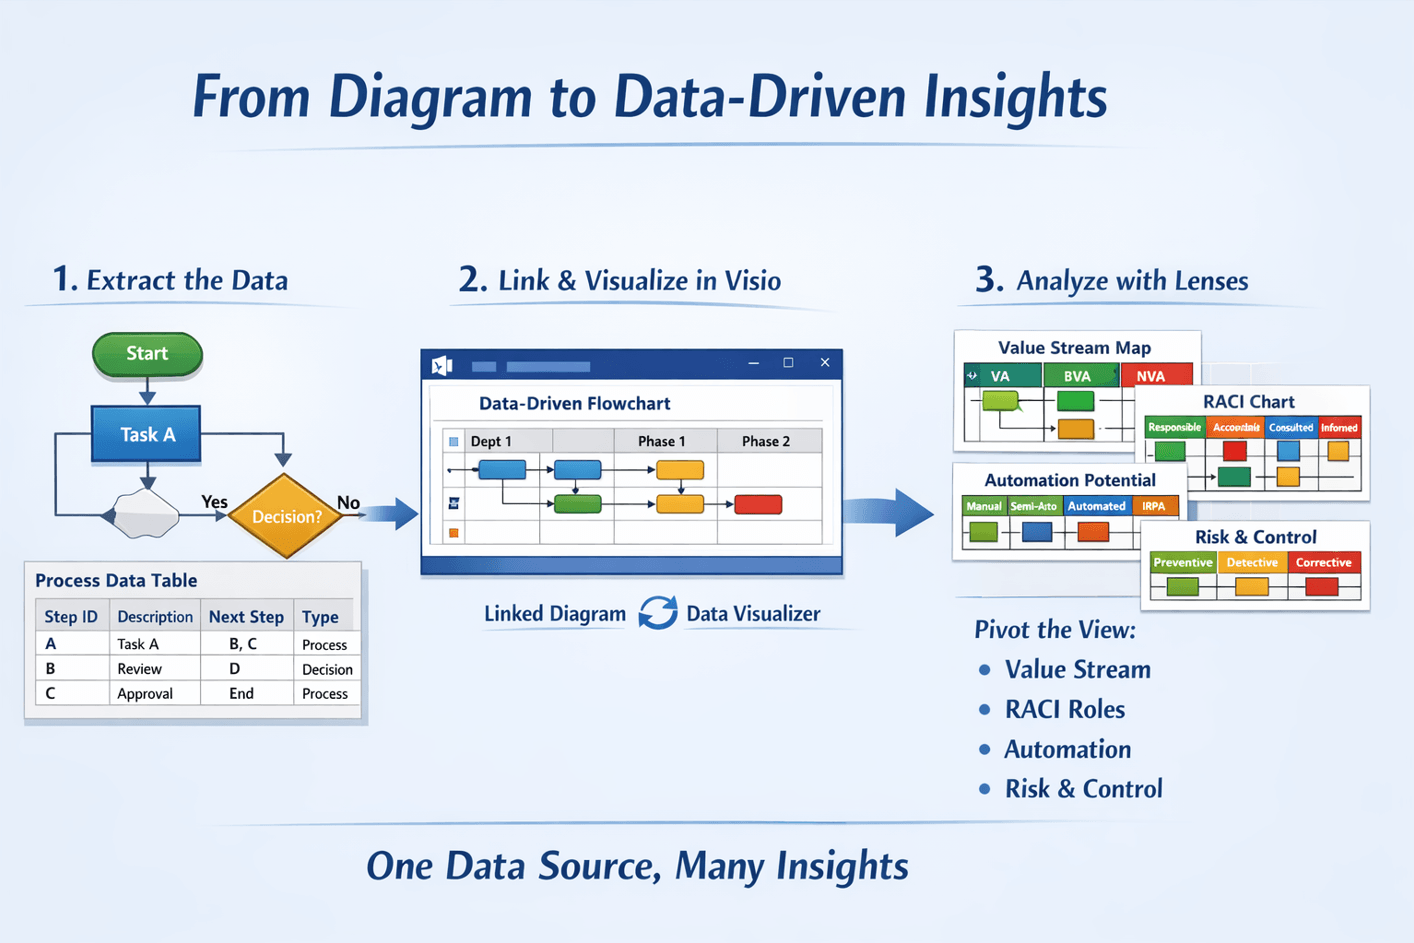
How to get the right output from a real .vsdx diagram
Here is the clean workflow that avoids chaos:
- Convert the diagram to a dataset. Use: Convert a Visio diagram to Excel (diagram → dataset).
- Validate the dataset. Use: dataset format rules and compare against: the cross-functional example.
- Import into Visio Data Visualizer. If you hit an error, do not guess – use: import troubleshooting.
- Upgrade the table into an audit tool. Add the governance columns that match how your organization actually works.
Start here (if you want the fastest win)
If your process map is already in Visio and it is painful to maintain, here is the move:
- Run Lite to prove the conversion on a real diagram: Download Lite (Free).
- Import the dataset into Data Visualizer and confirm it regenerates cleanly.
- Upgrade to Standard when you need unlimited steps: Standard details or Buy Standard.
FAQ
Is this a replacement for the Excel Visio Data Visualizer add-in?
No. It solves the reverse problem. The add-in is dataset → diagram. This workflow is diagram → dataset. If you already have a diagram and you need the table out of it, you’re in the right place.
What if I only need a list of steps, not a full dataset?
Start with the dataset anyway. Once the steps and connections are structured, you can filter it into any list or report you want. That is why the dataset is so valuable – it is reusable.
What Visio diagrams work best?
Best fit is Visio cross-functional flowcharts (swimlanes + phases) because they map cleanly to Data Visualizer dataset columns. You can also sanity-check structure using the basic flowchart dataset example.
What if my import fails?
Most failures are dataset integrity issues (duplicate IDs, missing referenced IDs, invalid shape types, inconsistent lane/phase values). Use: import troubleshooting.
Microsoft, Visio, and Excel are trademarks of Microsoft. This product is an independent tool and is not affiliated with Microsoft.