Why your Visio Data Visualizer import breaks: 7 failure modes and fixes
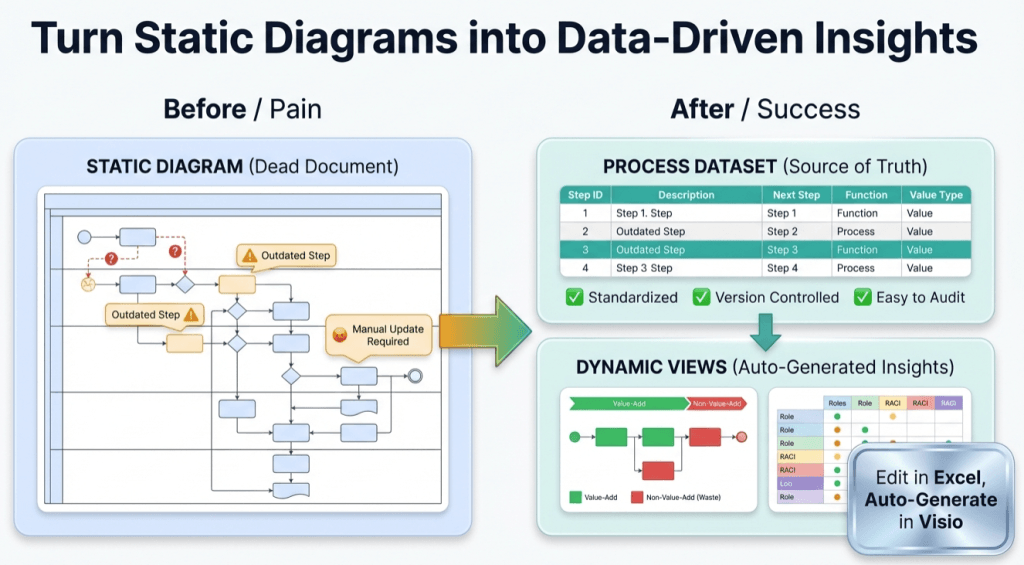
Here’s the truth: most “Visio Data Visualizer import errors” are not Visio problems. They are dataset integrity problems.
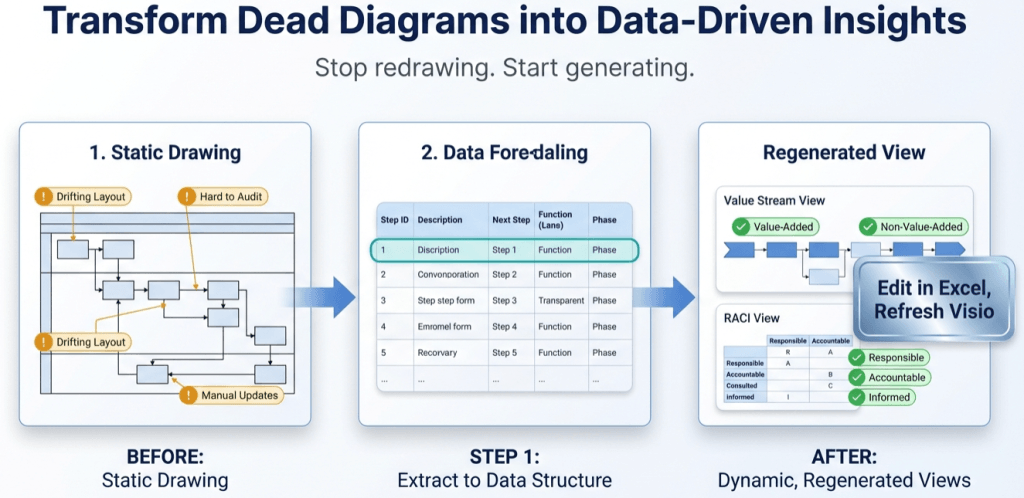
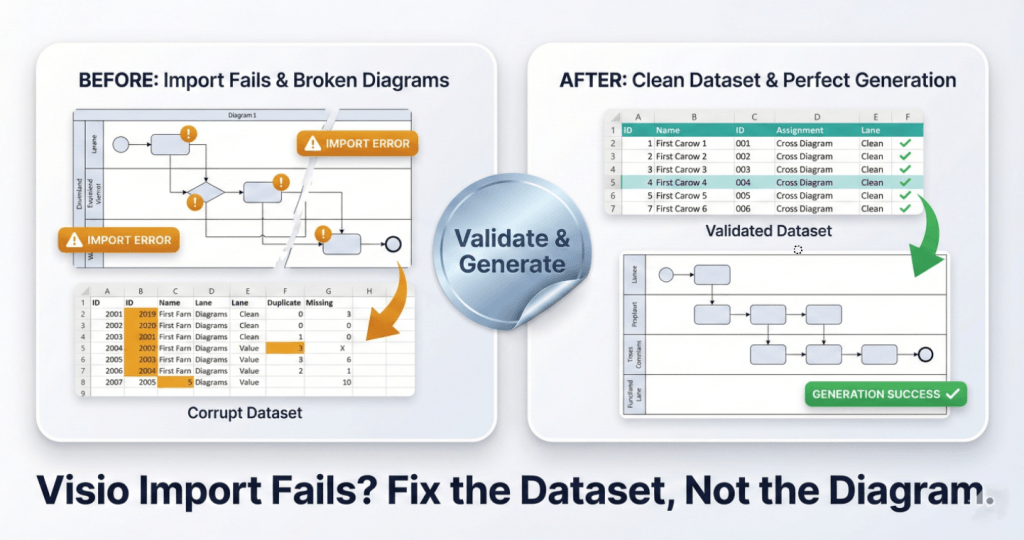
If you remember 1 thing: Import fails when the dataset is not internally consistent. Fix the dataset and the diagram becomes refreshable. That is the whole game.
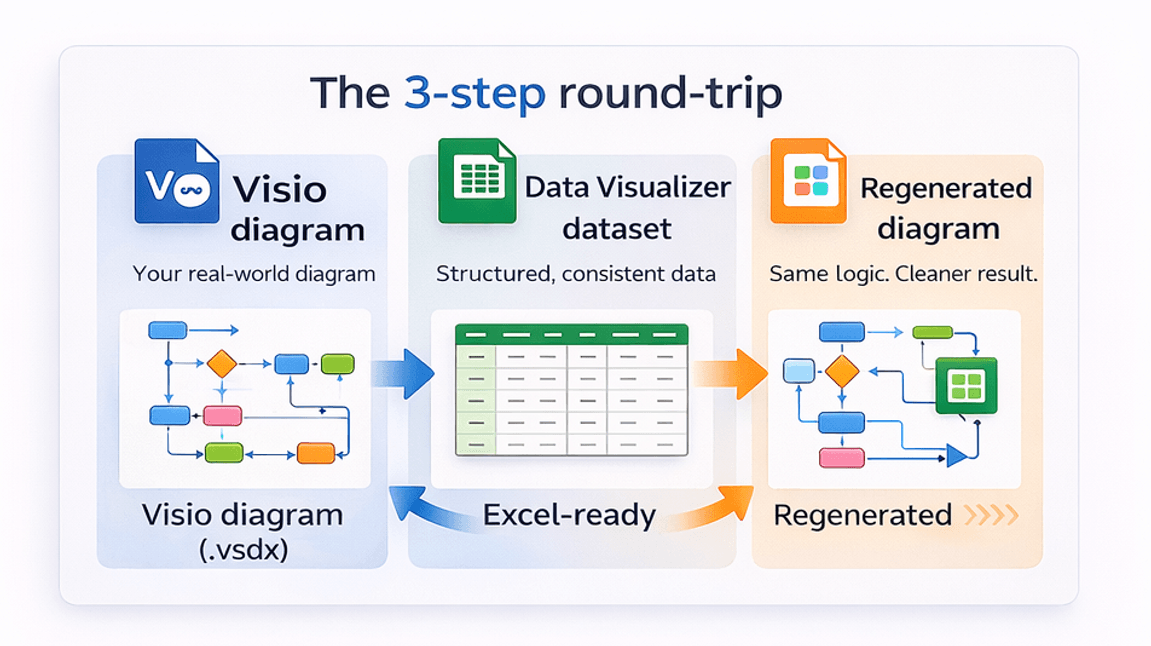
If you still need to generate the dataset from an existing diagram, start here: Convert a Visio diagram to Excel (diagram → dataset).
Important distinction: The Excel/Visio “Data Visualizer” direction is typically dataset → diagram. This workflow is the reverse: diagram → dataset.
Microsoft, Visio, and Excel are trademarks of Microsoft. This is an independent tool and is not affiliated with Microsoft.
Before you do anything else: run the 10-minute “sanity checklist”
If you are tempted to “just try stuff” until it works, stop. Here is the fastest path to a fix:
- Compare against a known-good dataset. Use: Cross-functional dataset example.
- Validate the dataset rules. Use: Data Visualizer dataset format.
- If you still fail, isolate the bad row. Use the binary-split method described below, or the full guide: Import troubleshooting.
The 7 failure modes (what it looks like, why it happens, and the fix)
| Failure mode | What you see | Root cause | Fix |
|---|---|---|---|
| 1) Duplicate Process Step IDs | Import fails immediately or diagram behaves unpredictably | 2 rows share the same ID | Make IDs unique and keep them stable over time |
| 2) Next Step ID points to a missing ID | Broken connectors, missing steps, or import errors | A connector references an ID that does not exist | Add the missing step or correct the reference |
| 3) Invalid Shape Type values | Wrong shapes, missing shapes, or import fails | Shape Type value does not match what the template expects | Use only allowed Shape Type values for your target template |
| 4) Lane/Phase inconsistency (cross-functional) | Swimlanes look scrambled or “random” | Function/Phase values are inconsistent (typos, near-duplicates) | Normalize lane/phase names and eliminate near-duplicates |
| 5) Branch formatting is wrong | Decisions behave oddly, wrong connectors | Multiple Next Step IDs not formatted correctly | Use correct separator and ensure each branch ID exists |
| 6) Missing required values | Import fails or creates incomplete diagram | Required fields are blank (depends on template) | Fill required columns consistently across rows |
| 7) Column mismatch (headers/order) | Import fails even when data looks “right” | Columns do not match what Visio expects | Align headers and structure to your template version |
Notice the pattern: none of these are “Visio is broken.” They are all fixable data problems.
The fastest way to isolate the bad row (binary split method)
When you have 1 hidden data issue, you do not debug by guessing. You debug by isolating.
- Make a copy of the dataset.
- Import the first half. If it works, the problem is in the second half.
- Repeat. Keep halving until you isolate a tiny failing set.
- Fix the failing rows, then import the full dataset.
This method is boring. That’s why it works. It kills hours of “maybe it’s this” and replaces it with certainty.
Excel checks you can run immediately
1) Duplicate ID check
=COUNTIF([Process Step ID],[@[Process Step ID]])Any value > 1 means you have a duplicate ID.
2) Missing Next Step ID reference check
If your Next Step ID contains multiple IDs, split it first, then validate each part.
=ISNUMBER(MATCH([@[Next Step ID]],[Process Step ID],0))3) Lane/Phase normalization check
Create a unique list of Function values and Phase values. Scan for near-duplicates caused by spacing, abbreviations, or typos. If you use cross-functional flowcharts, this single step fixes a shocking number of “scrambled lane” problems.
The deep guide is here: Data Visualizer import troubleshooting.
Where people lose money (and how to stop it)
Here is the trap: a team spends hours polishing a diagram that will drift again next week. The fix is to flip the source of truth.
If you already have a diagram and you need the dataset out of it, do this: Convert a Visio diagram to Excel (diagram → dataset). Then keep the dataset as the thing you maintain.
Lite makes this easy to prove. Run it on a real diagram, export the first 20 steps, and validate the workflow end-to-end.
FAQ
Why does Visio say “import failed” without telling me which row is bad?
It is frustrating, but it is normal. That’s why the binary split method works so well. You reduce the dataset until the failing set is small enough to inspect with certainty.
What is the most common failure mode?
In practice it’s usually 1 of these: duplicate IDs, missing referenced IDs, or inconsistent lane/phase values. Start there.
Does this tool replace the Data Visualizer add-in?
No. The add-in is dataset → diagram. This workflow is diagram → dataset. Different direction. Different problem.
Where should I start if I am brand new?
Start with the hub: Visio Data Visualizer (diagram → dataset), then run Lite: Download Lite.
Microsoft, Visio, and Excel are trademarks of Microsoft. This product is an independent tool and is not affiliated with Microsoft.