Business Analysis

infographic showing a workflow titled “One Process Model. Many Strategic Views.” On the left, an Excel-like process dataset table feeds into a central “Strategic Lenses” box containing icons for RACI (Responsible, Accountable, Consulted, Informed), Automation, Risk, Systems, and CX (Customer Experience). Blue arrows extend from the center to the right, where five simplified diagrams illustrate different views: RACI responsibilities, automation levels (manual, assisted, automated), risk indicators, connected systems, and customer experience touchpoints. A “Works with Microsoft Visio” badge appears near the top.

One Process Model, Many Views: RACI, Risk, Automation, and more (Pt. 3 Of 3)

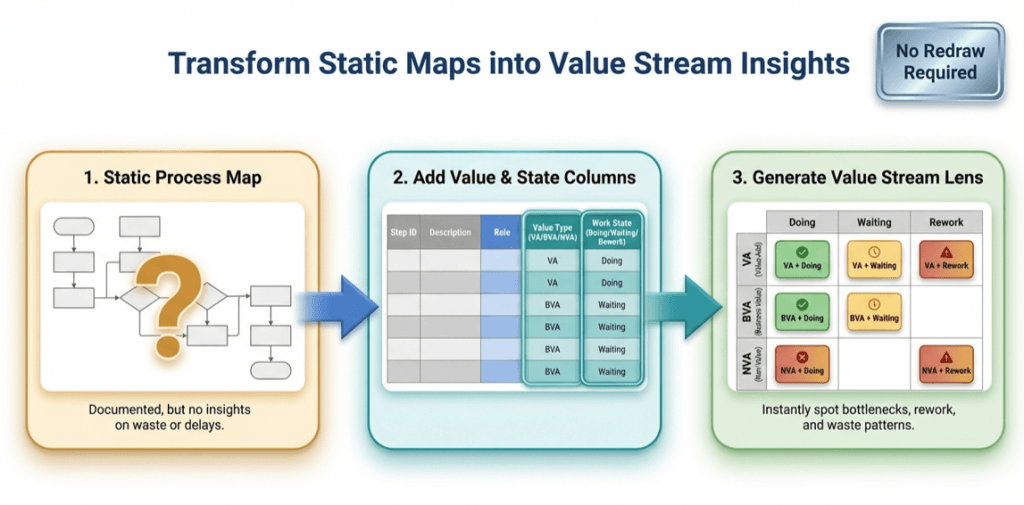
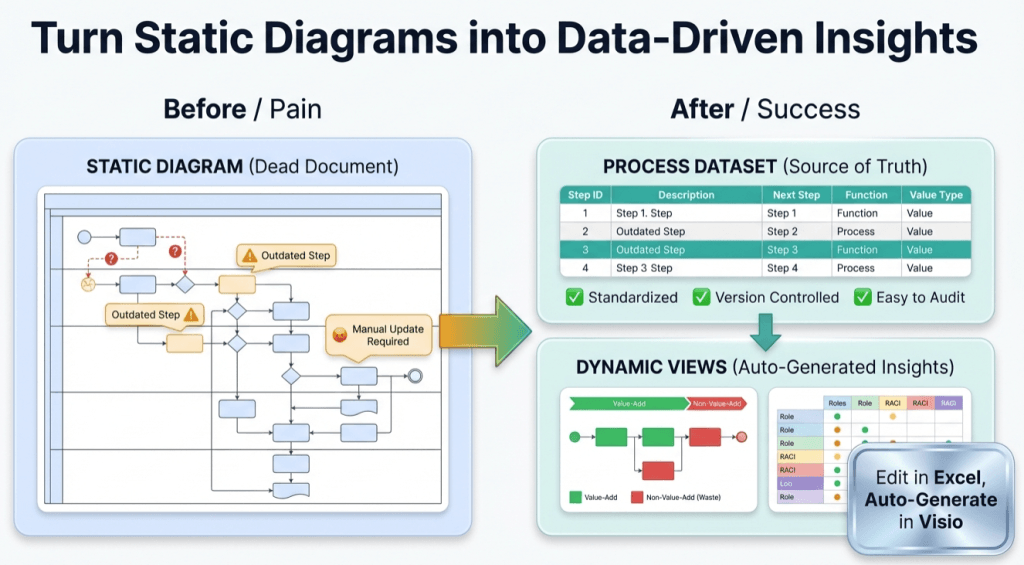
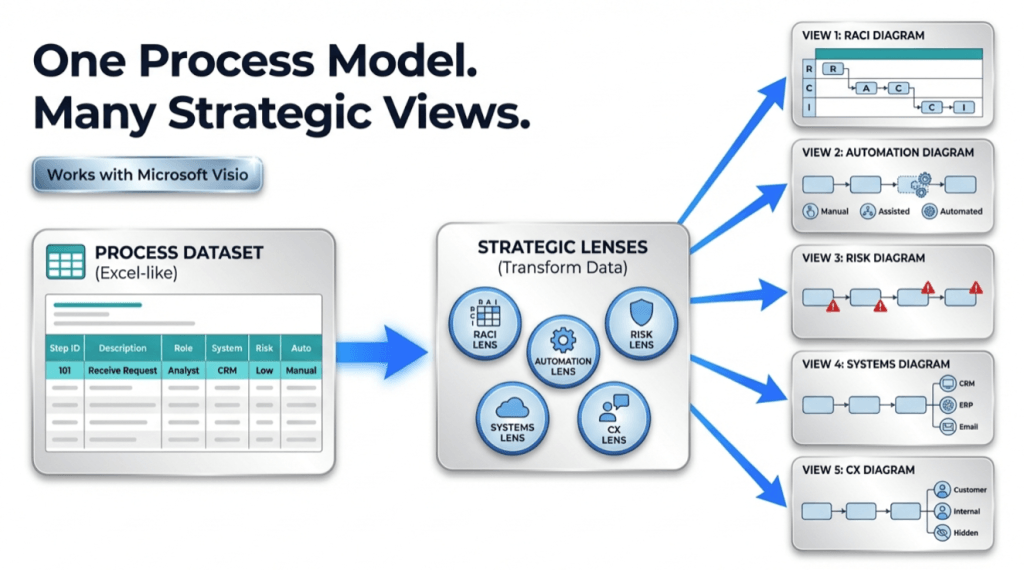
Once a process map exists as data, you can generate multiple “lenses” without redrawing: RACI ownership, automation potential, risk and controls, system touchpoints and handoffs, customer impact, and decision rights. Keep core step columns stable, add lens columns, then regenerate the diagram using those columns as swimlanes and phases. One model, many views – updated once.

One Process Model, Many Views: RACI, Risk, Automation, and more (Pt. 3 Of 3) Read More »

, , , , , , , , , ,
infographic titled ‘Transform Static Maps into Value Stream Insights.’ It shows a three-step flow from left to right: (1) a static process map with a question mark, labeled as documented but lacking insight; (2) a table adding value type (value-added, business value-added, non-value-added) and work state (doing, waiting, rework); and (3) a color-coded value stream lens matrix highlighting bottlenecks, waiting, rework, and waste. A badge in the top right reads ‘No Redraw Required

The Value Stream Lens: 1 process map, 9 insights (Pt. 2 of 3)

Once a process map exists as data, you can “re-lane” it without redrawing. This Lean value-stream lens replaces department swimlanes with VA/BVA/NVA and replaces phases with Doing/Waiting/Rework—creating a 3×3 grid of nine insights. It quickly surfaces bottlenecks, approval drag, and rework loops, and it’s easy to implement by adding two columns to your process table and regenerating the diagram.

The Value Stream Lens: 1 process map, 9 insights (Pt. 2 of 3) Read More »

, , , , , , , , , , ,
infographic titled ‘Turn Static Diagrams into Data-Driven Insights.’ On the left, a ‘Before / Pain’ section shows a cluttered static process diagram labeled ‘Static Diagram (Dead Document)’ with warning icons, outdated steps, question marks, and a note reading ‘Manual Update Required.’ In the center, a large green arrow points right. On the right, an ‘After / Success’ section shows a clean ‘Process Dataset (Source of Truth)’ table with step IDs and descriptions, checkmarks for standardized, version-controlled, and easy-to-audit processes, and a ‘Dynamic Views’ panel displaying value-add versus non-value-add flow and role responsibility charts. A callout reads ‘Edit in Excel, Auto-Generate in Visio.’ The overall message contrasts manual, outdated diagrams with automated, data-driven process insights.

Turn a Process Diagram Into Process Data – and keep it alive (Pt. 1 of 3)

Static process diagrams drift the moment reality changes. Fix it by treating the process as data: capture each step as a row (ID, description, next step, type, function, phase), generate a linked Visio Data Visualizer diagram from the table, then keep it current by updating the dataset and refreshing the diagram. One dataset, many views.

Turn a Process Diagram Into Process Data – and keep it alive (Pt. 1 of 3) Read More »

, , , , , , , , , , ,
Scroll to Top