
Most teams end up with multiple diagrams for the same process: an “ops view,” a “compliance view,” a “systems view,” and a “training view.” Then they argue about which one is “right.”
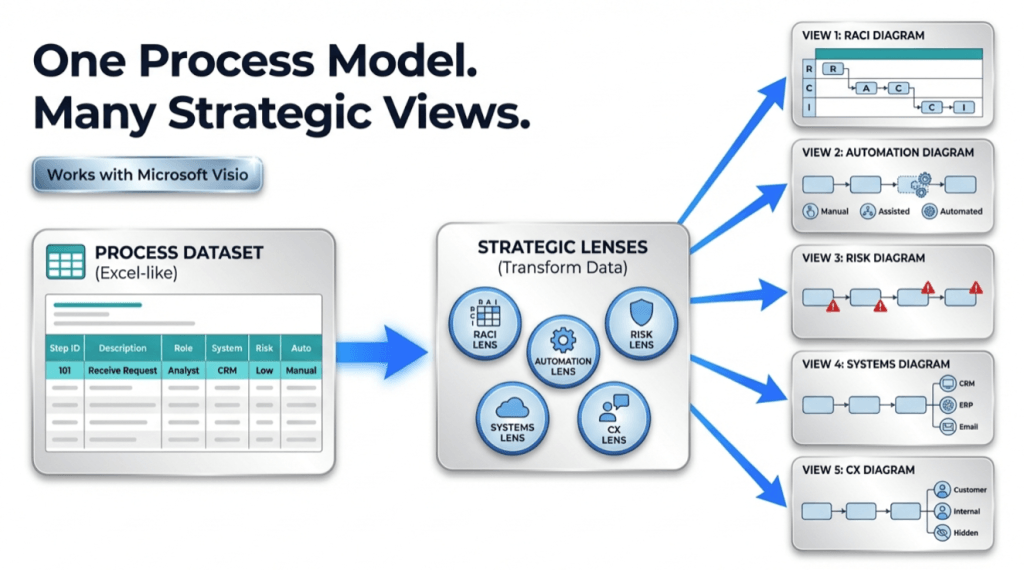
Pt. 3 goal: keep one process model as a dataset, and generate multiple stakeholder views (RACI, risk, automation, systems, CX) without redrawing.
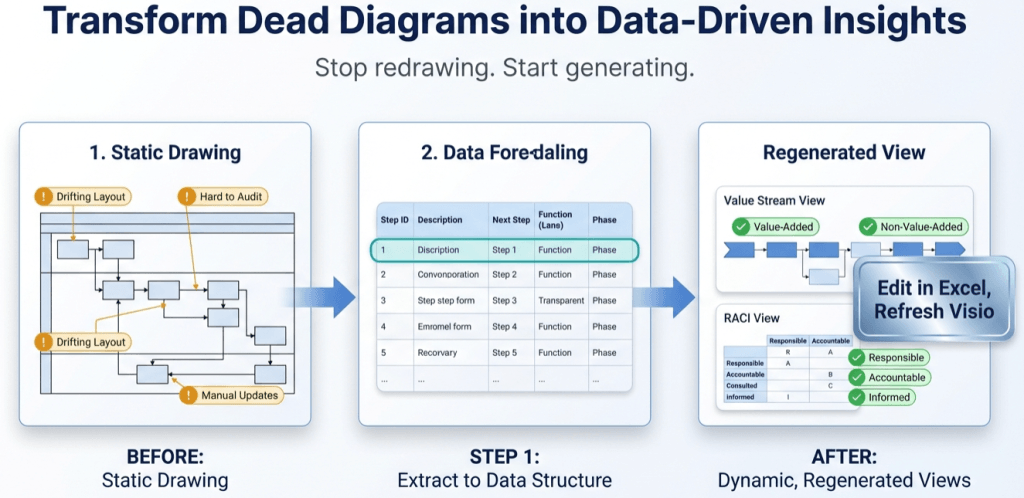
The core idea: lenses are just columns
If the process is a dataset, the diagram is a view. A “lens” is simply a set of columns that reorganize lanes/phases (or highlight certain steps) to answer a specific question.
The easiest way to build lenses is: add a lens column → map lanes/phases to that lens → regenerate the diagram.
Lens examples (you can apply to the same exact steps)
| Lens | Column(s) you add | What you learn |
|---|---|---|
| RACI | RACI (R/A/C/I) + Role/Owner | Responsibility gaps, overloaded roles, unclear accountability |
| Risk & control | Risk level + Control present? + Control type | Where controls exist, where they’re missing, and which steps are risk hotspots |
| Automation | Automation level (Manual / Assisted / Automated) + System | Best automation candidates; where manual work still dominates |
| Systems / integration | System touchpoint + Data entry? + Handoff type | Duplicate entry, reconciliation loops, integration pain points |
| Customer experience | CX touchpoint + Channel + SLA target | Where customer waits, where communication breaks, and which steps drive dissatisfaction |
| Value stream | Value type (VA/BVA/NVA) + Work state (Doing/Waiting/Rework) | Where time and effort are wasted (waiting + rework + NVA) |
If you want a concrete implementation guide for several lenses, use the dedicated page: RACI / value stream / risk / automation lenses.
How to generate multiple views from one model
- Start with a clean base dataset (Pt. 1 shows how).
- Add a lens column (e.g., AutomationLevel).
- Decide how the lens changes the view:
- Change swimlanes (Function → Role, or Function → Automation level)
- Change phases (Phase → Doing/Waiting/Rework, or Phase → Control category)
- Apply highlighting rules (risk hotspots, rework steps, system-heavy steps)
- Regenerate the diagram from the dataset (Data Visualizer). No redraw required.
- Keep the base dataset stable so every lens stays aligned to the same process.
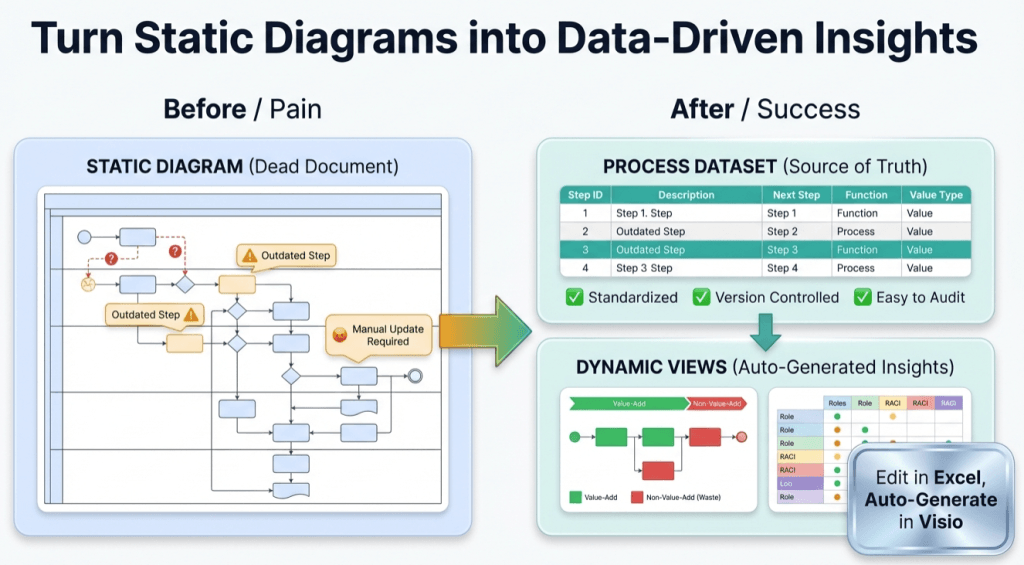
Governance rule: Don’t fork the process. Fork the view. One dataset, many lenses, many diagrams.
This is how you avoid “five diagrams that disagree about the same work.”
Where AI becomes useful (without hallucinating over pixels)
AI is most helpful when it can reason over a structured representation of the process: steps, IDs, roles, branches, and attributes. That’s exactly what a dataset provides.
If you want prompts and a workflow for that: AI analysis for Visio diagrams (dataset-first).
Close the loop: keep the diagram current
When the process changes (and it will), update the dataset and refresh the view. The work becomes:
- Add / edit a row
- Update lane/phase assignments
- Refresh the diagram
For the maintenance workflow: Update swimlane diagrams without redrawing.
FAQ
Do I need a different dataset for each lens?
No. Keep one base dataset. Add lens columns and generate different views (or export variants) without losing the shared source of truth.
Won’t this create too many diagrams?
You can generate as many views as needed, but you don’t have to maintain them manually. The dataset keeps them aligned.
How do I start without overengineering?
Start with one diagram. Convert it to a dataset. Then add one lens (value stream or RACI) and regenerate. Learn from that before expanding.