Most process diagrams die the same way.
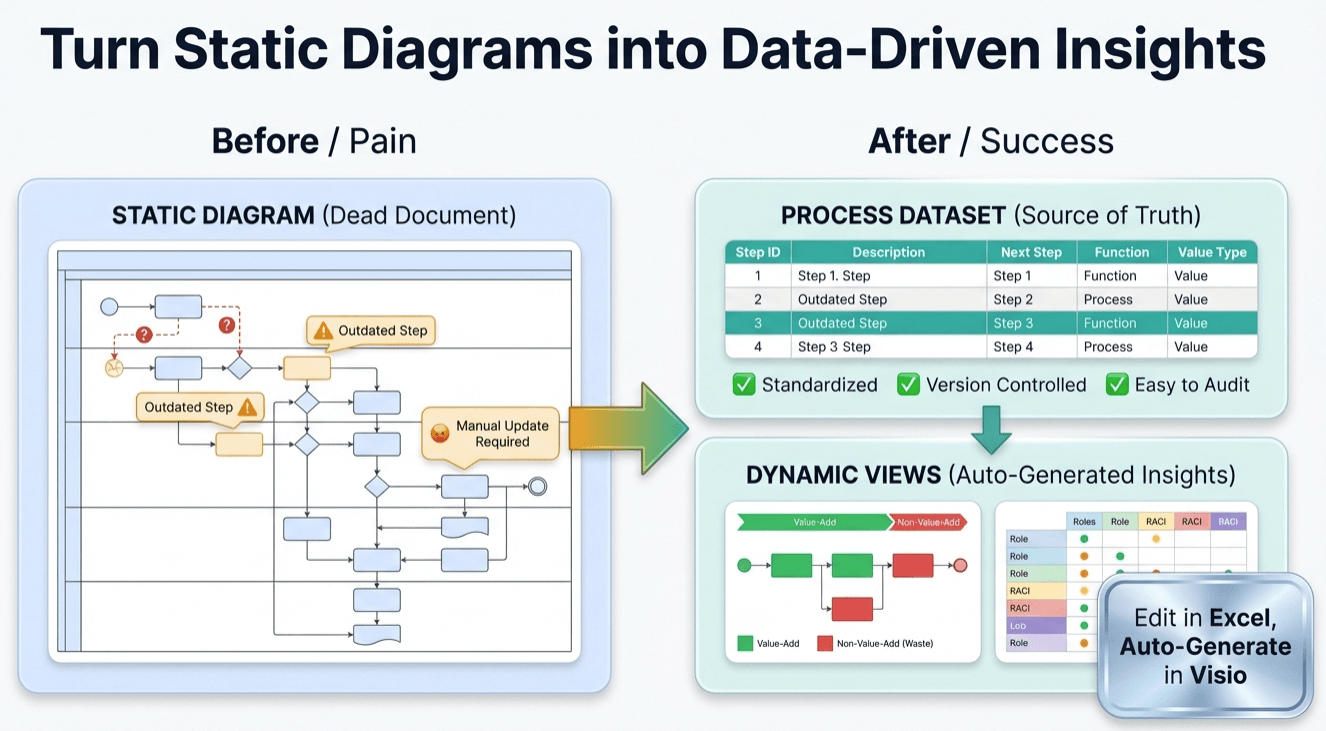
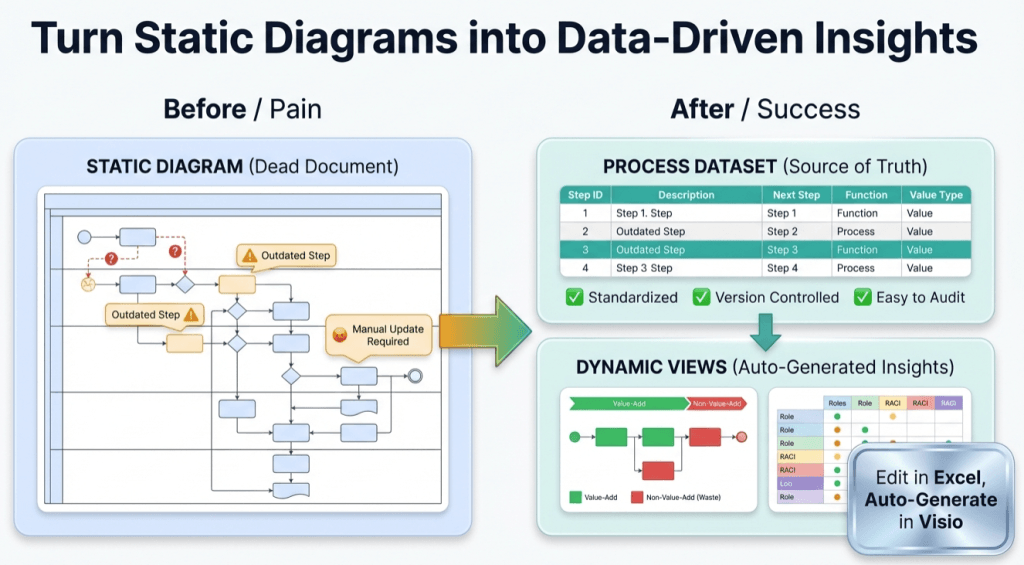
Most process diagrams die the same way: one update turns into a layout fight… and then updates stop happening. When that happens, your Visio file becomes a “dead document” — a picture of how work used to happen.
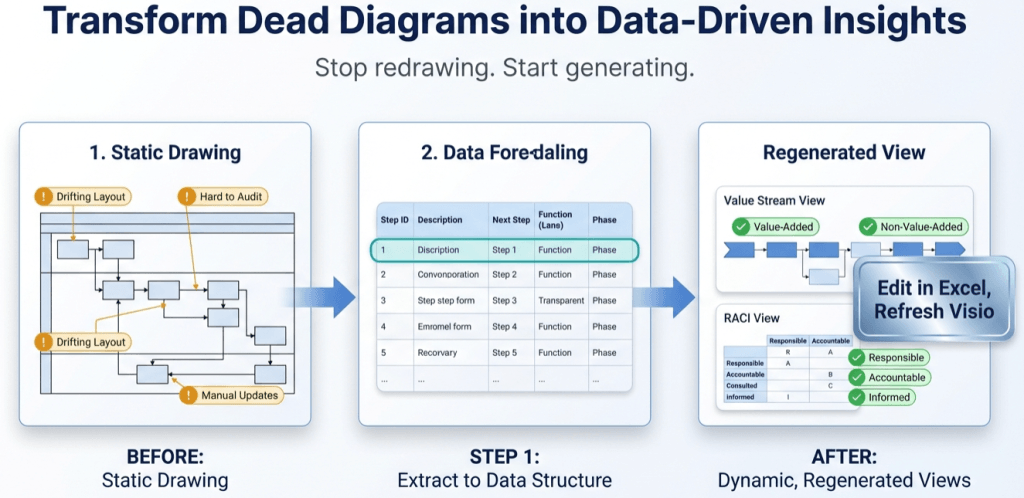
Pt. 1 goal: turn an existing diagram into process data (a Data Visualizer-ready dataset) so you can maintain the process as a table and regenerate the diagram as a view.
Direction matters: Visio Data Visualizer is usually dataset → diagram. This workflow is diagram → dataset so you can stop redrawing and start updating the source data.
Microsoft, Visio, and Excel are trademarks of Microsoft. This is an independent tool and is not affiliated with Microsoft.
The minimum dataset that keeps a diagram “alive”
A process diagram looks like shapes and connectors. A dataset captures the same thing as structured fields. You don’t need 50 columns — you need the columns that preserve logic and ownership.
For Data Visualizer workflows, these are the foundation:
- Process Step ID (stable, unique identifier)
- Process Step Description (the visible step text)
- Next Step ID (sequence / branching)
- Connector Label (e.g., Yes/No for decision branches)
- Shape Type (process, decision, start/end)
- Function (swimlane / owner)
- Phase (column / stage)
The exact rules vary by template, so keep this page handy: Data Visualizer dataset format (columns + rules).
A practical example dataset (small but real)
You’ll recognize the pattern: stable IDs, readable descriptions, and explicit “next step” links. This is the difference between a diagram you can keep updated vs a diagram that drifts.
| Process Step ID | Description | Next Step ID | Shape Type | Function | Phase | Connector Label |
|---|---|---|---|---|---|---|
| 10 | Receive request | 20 | Start/End | Requester | Intake | |
| 20 | Validate required fields | 30 | Process | Coordinator | Intake | |
| 30 | Complete? | 40; 20 | Decision | Coordinator | Intake | Yes; No |
| 40 | Approve request | 50 | Process | Manager | Approval | |
| 50 | Notify completion | Start/End | Coordinator | Close |
Note: Some templates allow multiple next steps separated by a delimiter (for decisions). Match the exact format your template expects. If imports fail, the troubleshooting page is your fastest fix: Fix Data Visualizer import errors.
The “keep it alive” rules
Rule 1: Step IDs must be stable
The fastest way to break a dataset-driven workflow is renumbering IDs every time you change the process. IDs should behave like primary keys — not like row numbers.
Pro tip: Use gaps (10, 20, 30…) or meaningful IDs so you can insert steps later without renumbering everything.
A dataset that can’t accept insertions without renumbering is a dataset that will eventually drift.
Rule 2: Make “Next Step” explicit (especially at decisions)
In diagrams, branch logic is implied by lines. In datasets, branch logic must be explicit. Decision steps often cause import problems because the “Yes/No” labeling is inconsistent, missing, or reversed.
Rule 3: Use lane and phase consistently
Swimlanes and phases are not decoration — they are the foundation for analysis: handoffs, bottlenecks, rework, and “lenses” all depend on those columns being clean.
How to convert your diagram without manual pain
You can do this by hand (slow) or with the generator (fast). The generator exists for one reason: to convert what Visio already knows about your shapes/connectors into dataset rows.
Fast method (recommended)
- Download the generator. Start with Lite to validate on a real diagram.
- Select your .vsdx (best fit: cross-functional flowchart / swimlane diagram).
- Export the dataset. Open it in Excel and run quick checks (IDs, missing next steps, lane/phase consistency).
- Import into Data Visualizer. Generate a linked diagram (now the dataset is the source of truth).
Download Lite (Free) See Standard details

Quick audit checklist (before you import)
If you do these checks in Excel first, your import success rate goes way up.
- Duplicate IDs: every Process Step ID is unique
- Missing next steps: no unintended “dead ends”
- Decision branches: every decision has the correct number of outcomes + labels
- Lane values: function names are standardized (no “Ops” vs “Operations” drift)
- Phase values: phase names are standardized and ordered
- Shape type values: match what the template expects
If something breaks, use this as your debugging playbook: Data Visualizer import troubleshooting.
Next in the series
Once your diagram is data, you can stop arguing about “the” diagram and start generating decision-ready views. Next up:
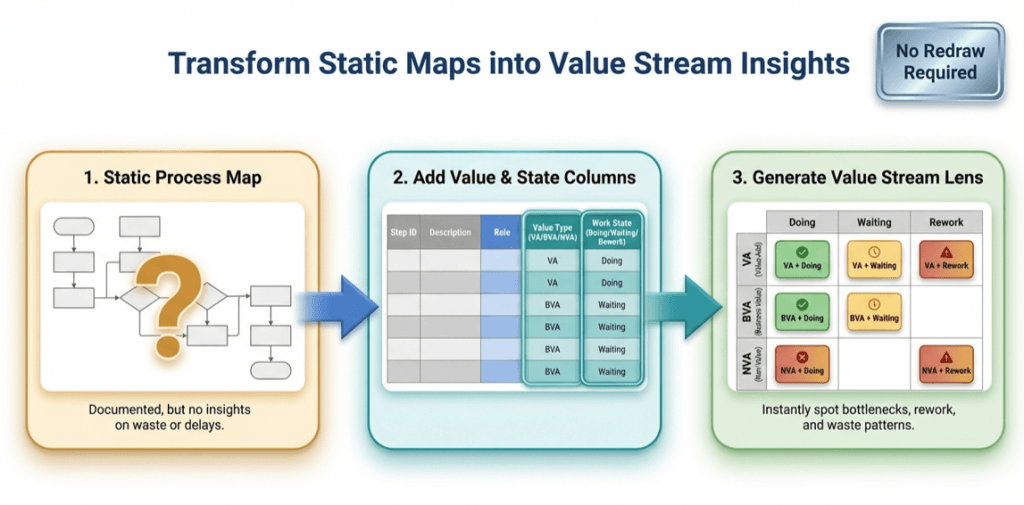
- Pt. 2: The value stream lens (VA/BVA/NVA × Doing/Waiting/Rework)
- Pt. 3: One process model, many views (RACI, risk, automation, systems)
FAQ
Will this work on any Visio diagram?
Best fit is cross-functional flowcharts (swimlanes + phases). Basic flowcharts can work too, but you get the most value when lane/phase structure exists.
Why not just keep editing the Visio diagram?
You can — but updates get expensive because layout fights back. The dataset workflow makes updates cheap: change the data, refresh the diagram.
What should I do first?
Run Lite on a real diagram and export the first 20 steps. Validate that you can import into Data Visualizer and regenerate a clean view.