Swimlanes as data: the Function field that makes or breaks cross-functional imports
If your cross-functional Data Visualizer diagram looks scrambled, “random,” or impossible to read, the cause is usually not connectors. It’s not the shape types. It’s not Visio.
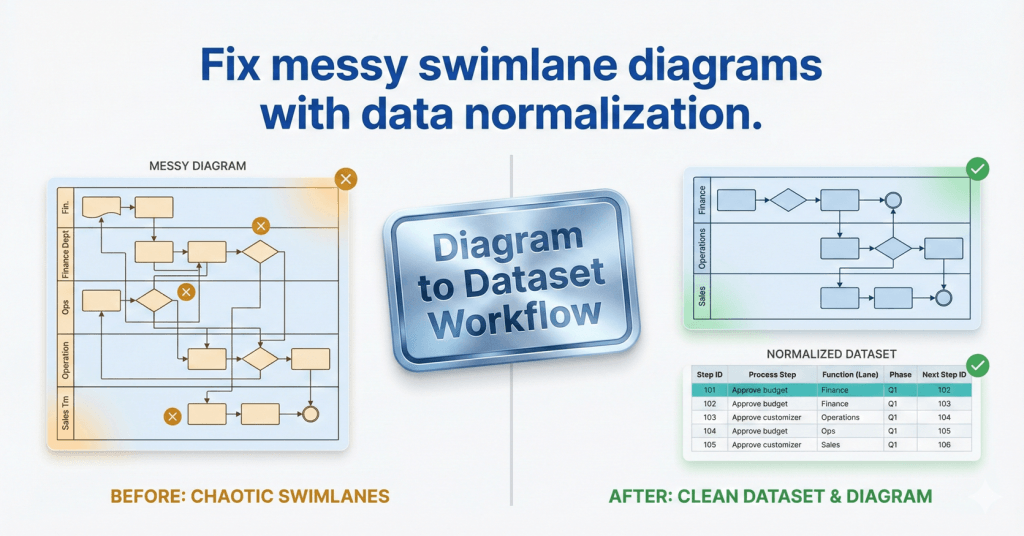
The cause is usually this: inconsistent Function values. Function is the swimlane assignment. If your lane names are messy, your diagram will be messy.
If you still need the dataset out of an existing .vsdx first, start here: Convert a Visio diagram to Excel (diagram → dataset).
Important distinction: The Excel/Visio “Data Visualizer” direction is typically dataset → diagram. This workflow is the reverse: diagram → dataset.
Microsoft, Visio, and Excel are trademarks of Microsoft. This is an independent tool and is not affiliated with Microsoft.
What Function really means (and what it does not)
Think of Function as: “Which lane does this step live in?” Not “who touched it last.” Not “who is mentioned in the step.” Not “the person’s job title.”
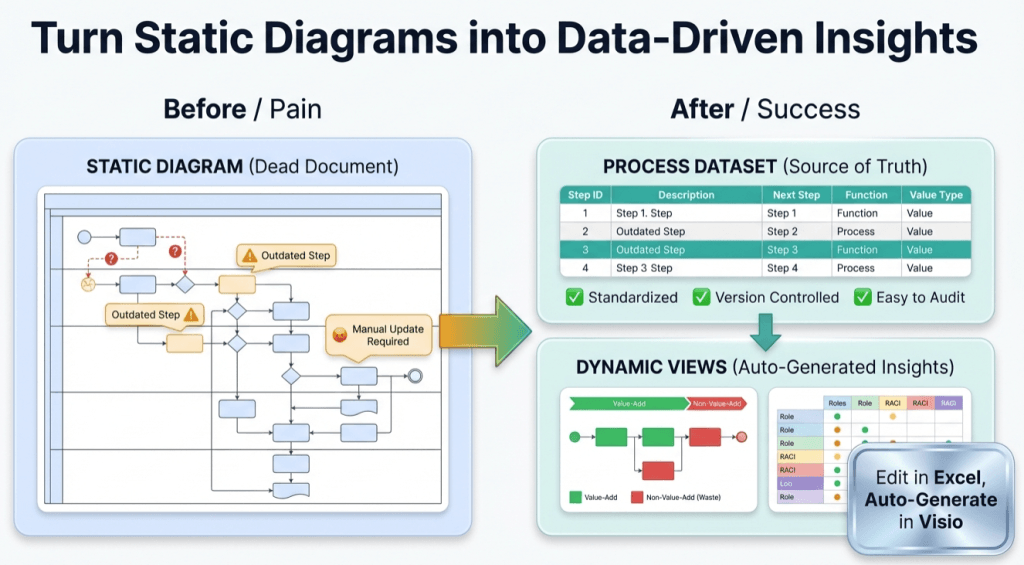
Function is a category label that drives layout and structure. If your Function values drift, the diagram becomes unmaintainable. And once it is unmaintainable, updates stop, drift starts, and the diagram becomes a dead artifact.
If you want the dataset rules, use: Data Visualizer dataset format.
The lane rules that prevent chaos
If you do nothing else, do these 5 things:
- Choose a lane taxonomy and write it down (teams, departments, systems, or roles).
- Use 1 canonical name per lane. No synonyms. No abbreviations. No “Finance” vs “Fin.”
- Use TRIM-safe text. Remove trailing spaces and weird invisible characters.
- Keep lane names stable over time. When you rename lanes, you change the entire diagram layout.
- Do not over-fragment lanes. 8 to 12 lanes is often manageable; 25 lanes is usually a disaster.
Counterintuitive truth: you are not “losing detail” by consolidating lanes. You are gaining clarity and maintainability. If you need detail, add it as data columns – not as lane explosion.
The 5-minute Function audit in Excel
Here is how you catch 90% of Function problems before you import:
- Create a unique list of Function values (Remove Duplicates).
- Scan for near-duplicates (typos, spacing, abbreviations).
- Standardize to a canonical list.
- Re-import.
If your lanes are messy, your diagram will be messy. Always.
Excel cleanup helpers
Use a helper column to normalize lane text:
=TRIM(CLEAN([@[Function]]))If you want consistent capitalization:
=PROPER(TRIM(CLEAN([@[Function]])))Then replace the original Function values with the cleaned values (paste values only), and verify the unique list again.
A practical lane strategy that scales
Lane design is not “what is true in the universe.” It is “what makes the process easiest to maintain and discuss.”
A strong default lane strategy for business processes is:
- Customer (if applicable)
- Frontline / Requester
- Operations
- Manager / Approver
- Finance
- IT / System (only if system steps are explicit)
[Inference] This keeps the conversation at the “system” level, not the “every job title in the company” level.
What about RACI?
Do not try to force RACI into swimlanes. Swimlanes are 1 label per step. RACI is 4 labels per step.
The clean method is: keep Function as lane assignment, and add RACI as data columns. Then you can generate multiple “lenses” without maintaining multiple drifting diagrams.
That is exactly what this page is for: RACI / value stream / process lenses.
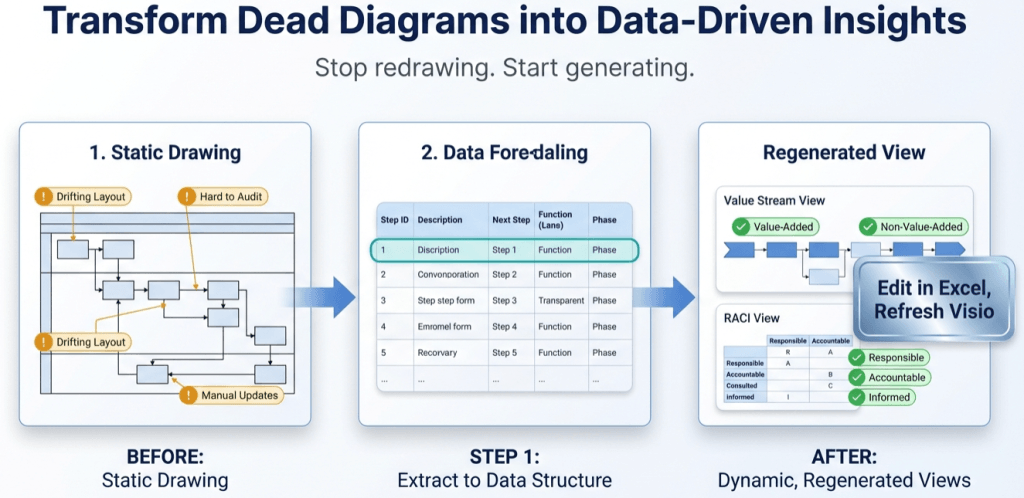
How this ties into “diagram → dataset” (and why it sells)
If you maintain cross-functional flowcharts in Visio, you already know the pain: small changes force you into layout work. Layout work is why updates stop.
The way out is to convert once, then maintain the process as data:
- Convert the diagram to a dataset: Convert a Visio diagram to Excel (diagram → dataset).
- Normalize Function values so lanes stay clean.
- Regenerate the diagram from the dataset and refresh as you evolve the process.
Want to prove it fast? Run Lite on a real diagram and export the first 20 steps. If it regenerates cleanly, you have your answer.
FAQ
Should Function be a person, a team, or a system?
Use whatever makes the process easiest to maintain and discuss. Most teams do best with department or role-level lanes, not individual names. If you need person-level detail, add it as a column, not a lane.
My lanes are correct but the diagram still looks messy. What next?
Next check Phase values and branching (Next Step IDs). Use: Import troubleshooting.
Is this a replacement for the Excel Visio Data Visualizer add-in?
No. The add-in is dataset → diagram. This workflow is diagram → dataset. Different direction. Different job.
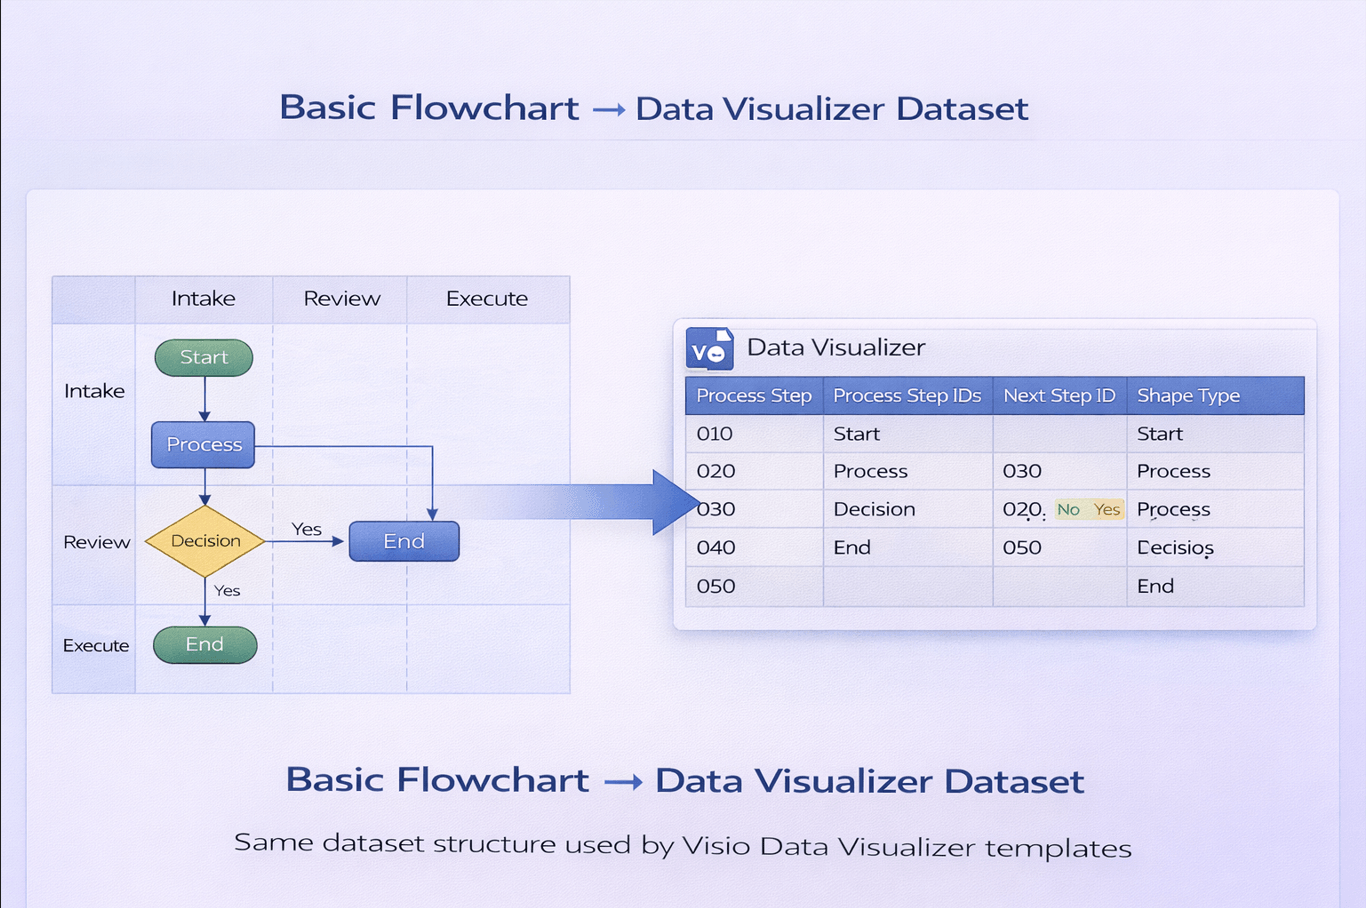
Where can I see a correct cross-functional dataset example?
Microsoft, Visio, and Excel are trademarks of Microsoft. This product is an independent tool and is not affiliated with Microsoft.