
Cross-functional flowchart dataset example (swimlanes + phases)
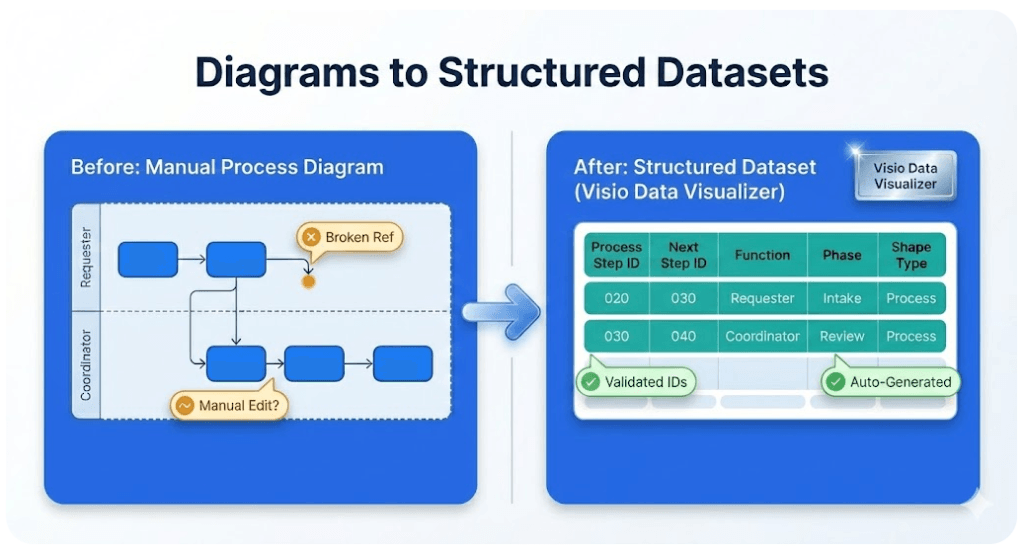
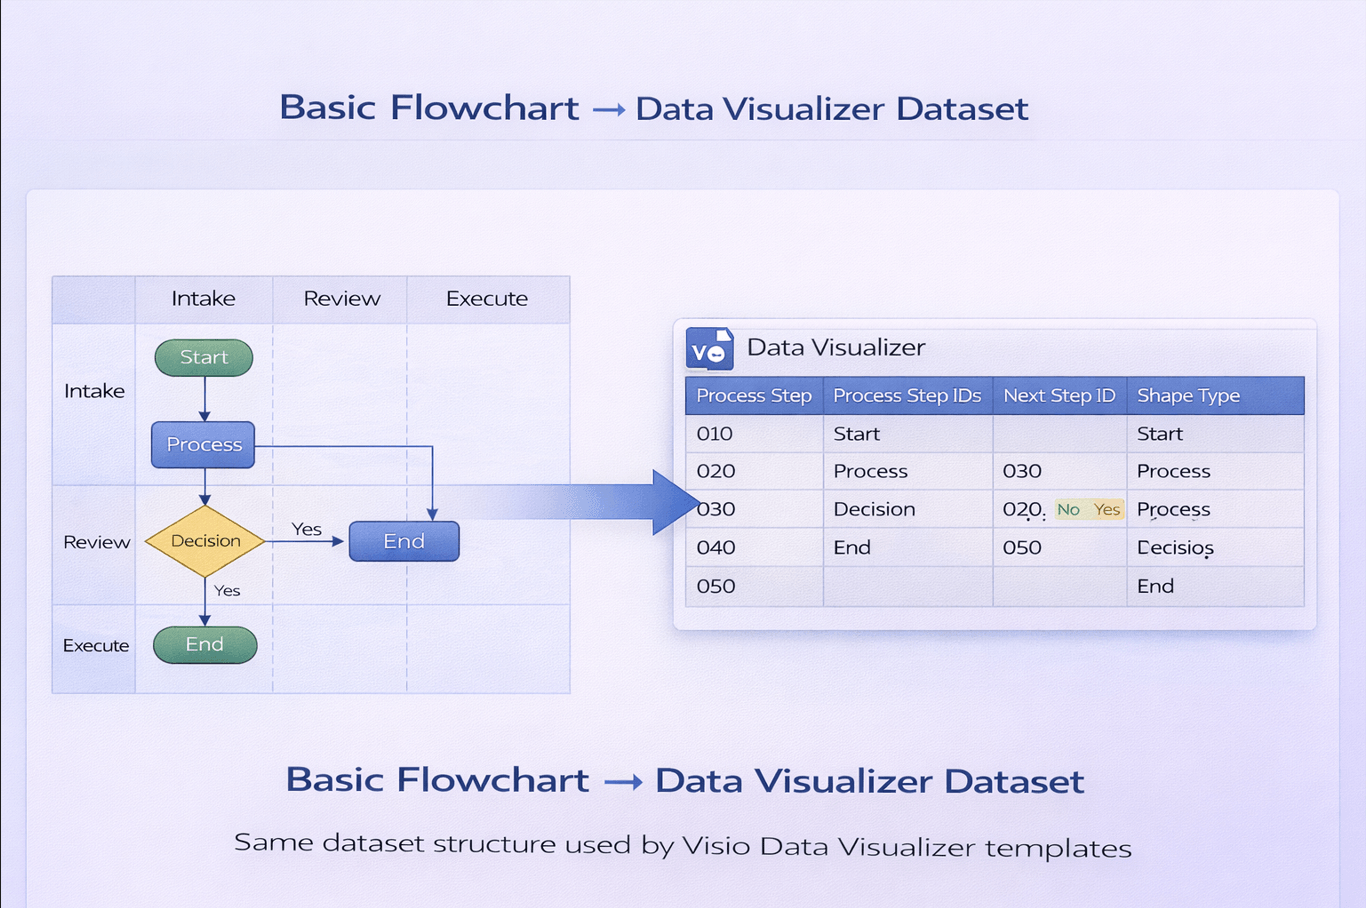
This is a practical, copy/paste-friendly example of a Data Visualizer dataset for a cross-functional (swimlane) flowchart. Use it to sanity-check your columns, IDs, and connector logic before importing into Visio’s Cross-Functional Flowchart (Data Visualizer) template.
If your starting point is an existing Visio diagram and you want the dataset in Excel, start here: Convert a Visio diagram to Excel (diagram → dataset).
Try Lite (Free) See dataset format rules
Example dataset table
The keys to notice: unique step IDs, Next Step IDs that exist, and consistent Function (lane) and Phase values. This example includes a branch (comma-separated Next Step IDs).
| Process Step ID | Process Step Description | Next Step ID | Shape Type | Function | Phase |
|---|---|---|---|---|---|
| 1 | Start | 2 | Start/End | Employee | Initiate |
| 2 | Submit request | 3 | Process | Employee | Initiate |
| 3 | Review request | 4 | Process | Manager | Review |
| 4 | Approved? | 5,6 | Decision | Manager | Review |
| 5 | Reject request | 9 | Process | Manager | Review |
| 6 | Validate details | 7 | Process | Operations | Execute |
| 7 | Complete work | 8 | Process | Operations | Execute |
| 8 | Notify completion | 9 | Process | Employee | Close |
| 9 | End | Start/End | Employee | Close |
How to use this example in Visio Data Visualizer
- Create an Excel sheet with the same columns.
- Paste the rows above.
- In Visio, start Cross-Functional Flowchart (Data Visualizer) and import the dataset.
- Confirm lanes (Function) and phases align, then regenerate.
If Visio throws an error, use: Import troubleshooting.
If your main goal is exporting a real diagram into Excel, start here: Convert a Visio diagram to Excel (diagram → dataset).
Common modifications teams make
- Normalize step text: rewrite descriptions to “verb + object + condition” for consistency.
- Add ownership: add Responsible/Owner fields (or a RACI lens) and regenerate a new view.
- Add timing: add cycle time / wait time fields to highlight bottlenecks.
- Add system tags: classify steps by system/tool to find automation opportunities.
For multi-view lenses (RACI, value stream, risk, automation), see: Process lenses.
Back to hub · Convert a Visio diagram to Excel
Microsoft, Visio, and Excel are trademarks of Microsoft. This product is an independent tool and is not affiliated with Microsoft.