
Convert a Visio Diagram to an Excel Dataset
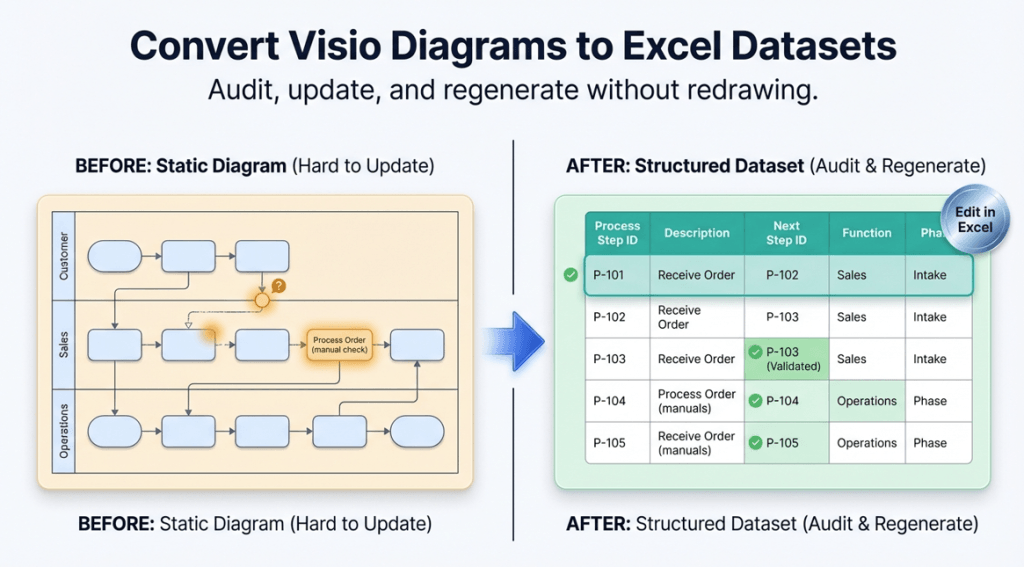
Turn an existing Visio swimlane diagram (cross-functional flowchart) into a Data Visualizer-ready dataset: diagram → Excel table — so you can audit, update, and regenerate clean diagrams without redrawing.

Important distinction: Most people think “Data Visualizer” means dataset → diagram. This page is about the reverse workflow: diagram → dataset. That’s the missing half of the loop if you already have lots of Visio diagrams.
Microsoft, Visio, and Excel are trademarks of Microsoft. This is an independent workflow and toolset.
What you can do once your diagram becomes a dataset
- Audit in Excel: duplicates, missing next steps, inconsistent decision labels, orphan steps, loops
- Update without redrawing: edit a row, refresh the view
- Standardize language: make step naming consistent and measurable
- Generate multiple views: value stream, RACI, risk & control, automation candidates, systems touchpoints
- Analyze with AI: structured data is easier to reason over than pixels
If you’re building a process-improvement “silo,” these pages connect directly: Audit · Update · Lenses · AI analysis
Two ways to get from Visio → Excel
You can do this manually, or you can export with a generator. Manual works for tiny diagrams. Software is for real-world diagrams.
| Method | Best for | Tradeoffs |
|---|---|---|
| Manual extraction | Very small diagrams, learning the dataset rules | Slow, error-prone, hard to repeat, painful at decisions/handoffs |
| Dataset generator | Real swimlane diagrams, ongoing maintenance, multi-view analysis | Requires using the tool, but saves hours and reduces drift |
Recommended path: Use Lite to validate on a real diagram (first 20 steps), then upgrade to Standard when you’re ready to convert full diagrams (unlimited steps).
Step-by-step: convert a Visio diagram to Excel dataset
- Pick the right diagram. Best fit is a cross-functional flowchart (swimlanes + phases) where ownership and stage matter.
- Export the dataset. Use the generator to create a Data Visualizer-ready Excel table from your .vsdx.
- Run quick checks in Excel. Validate IDs, next-step links, decision outcomes, lane values, and phase values.
- Import into Data Visualizer. Generate a linked diagram from the dataset so you can refresh/regenerate as the process changes.
- Maintain as data. Add steps as rows, standardize wording, reassign ownership, and refresh the diagram instead of redrawing.
If import errors show up, this page is the fastest way to isolate the cause: Data Visualizer import troubleshooting.
The dataset rules that matter most
Data Visualizer datasets are simple, but strict. These are the rules that cause most errors:
- Unique IDs: every step has a stable Process Step ID
- Valid “Next Step” references: every Next Step ID points to a real step
- Decision branches: outcomes and connector labels are consistent
- Shape type values: match what the template expects
- Lane/phase values: consistent naming (avoid “Ops” vs “Operations” drift)
For the exact format and templates: Data Visualizer dataset format.
Next steps after you have the dataset
Once you can export a dataset reliably, these are the highest-ROI next moves:
- Audit for drift and defects (in Excel).
Audit a Visio process map in Excel - Make one update without redrawing (prove the maintenance loop).
Update swimlane diagrams without redrawing - Generate one lens view (value stream or RACI).
Multi-view process lenses
FAQ
Is this a “Visio to Excel export” feature inside Visio?
Not exactly. This workflow is about exporting a dataset that matches the Data Visualizer format so you can regenerate linked diagrams and maintain the process as data.
Does this work for basic flowcharts too?
Yes, but the biggest benefit comes from swimlane diagrams where ownership (Function) and stage (Phase) matter.
Do I need to upload my diagram anywhere?
No. The generator runs locally on Windows. You control where your files live.
Where should I start?
Start with Lite on a real diagram segment (first 20 steps). If it imports cleanly into Data Visualizer, you’re ready for Standard on full diagrams.